
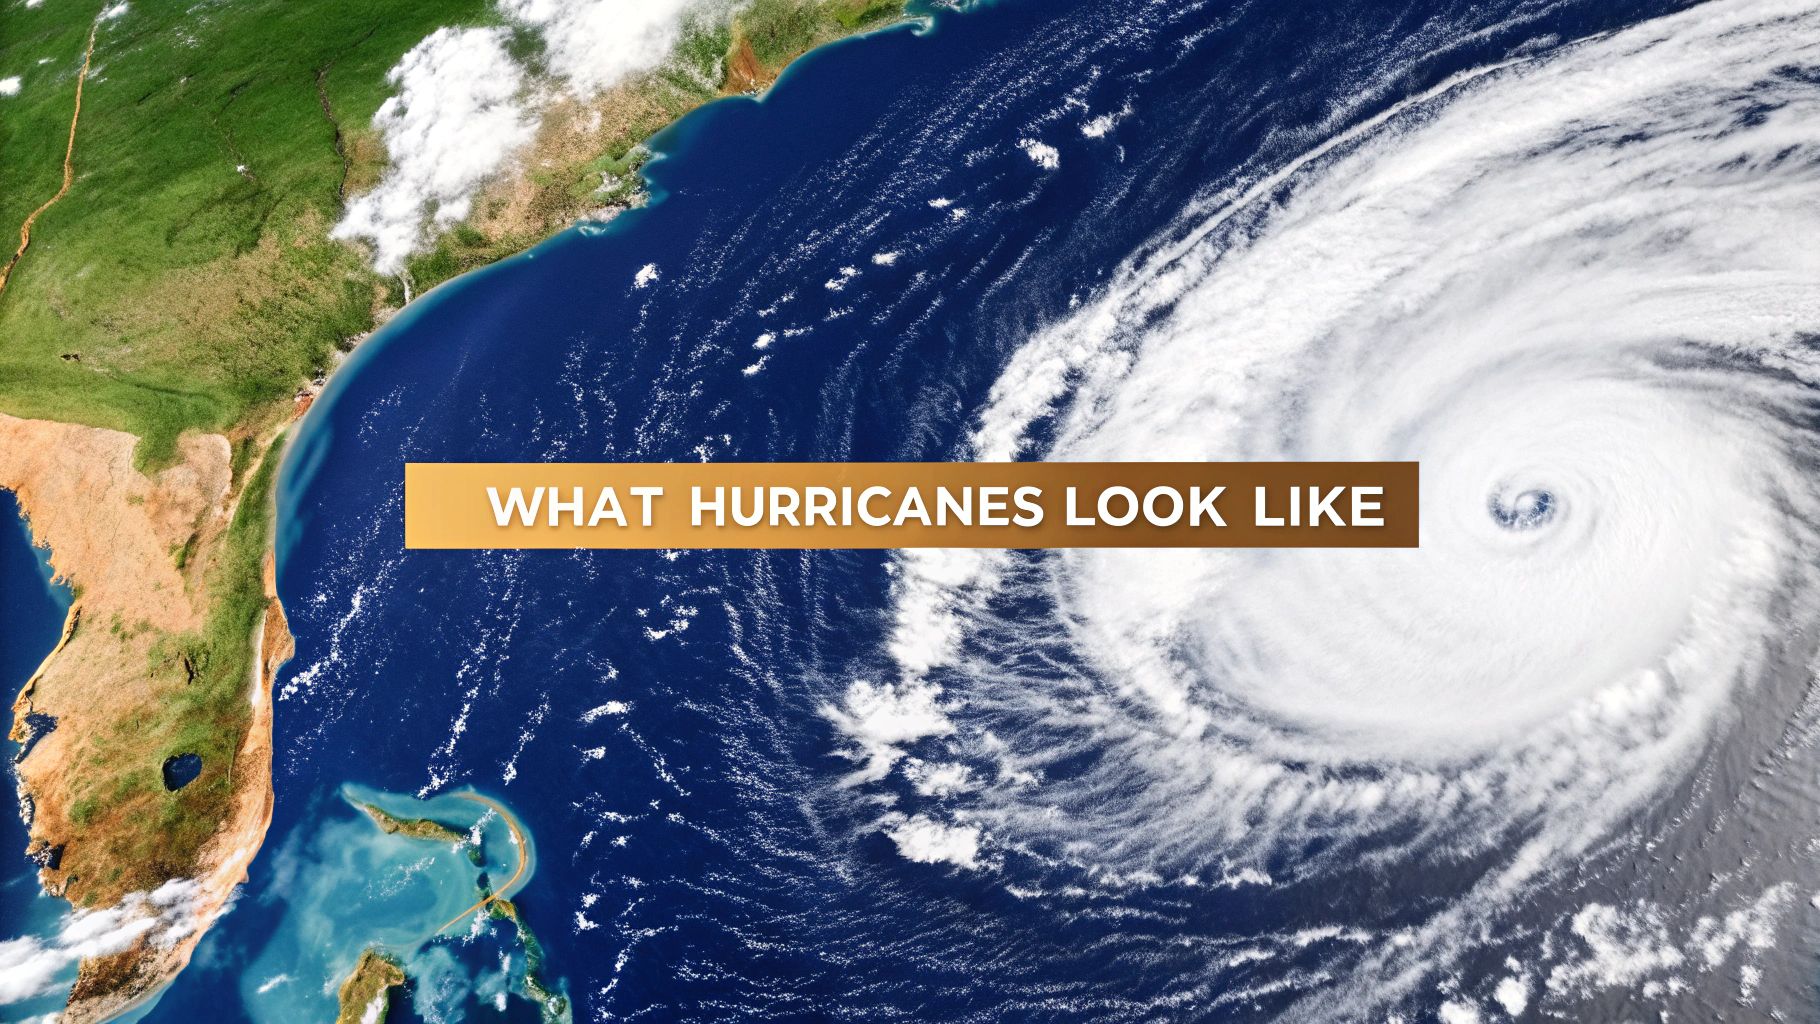
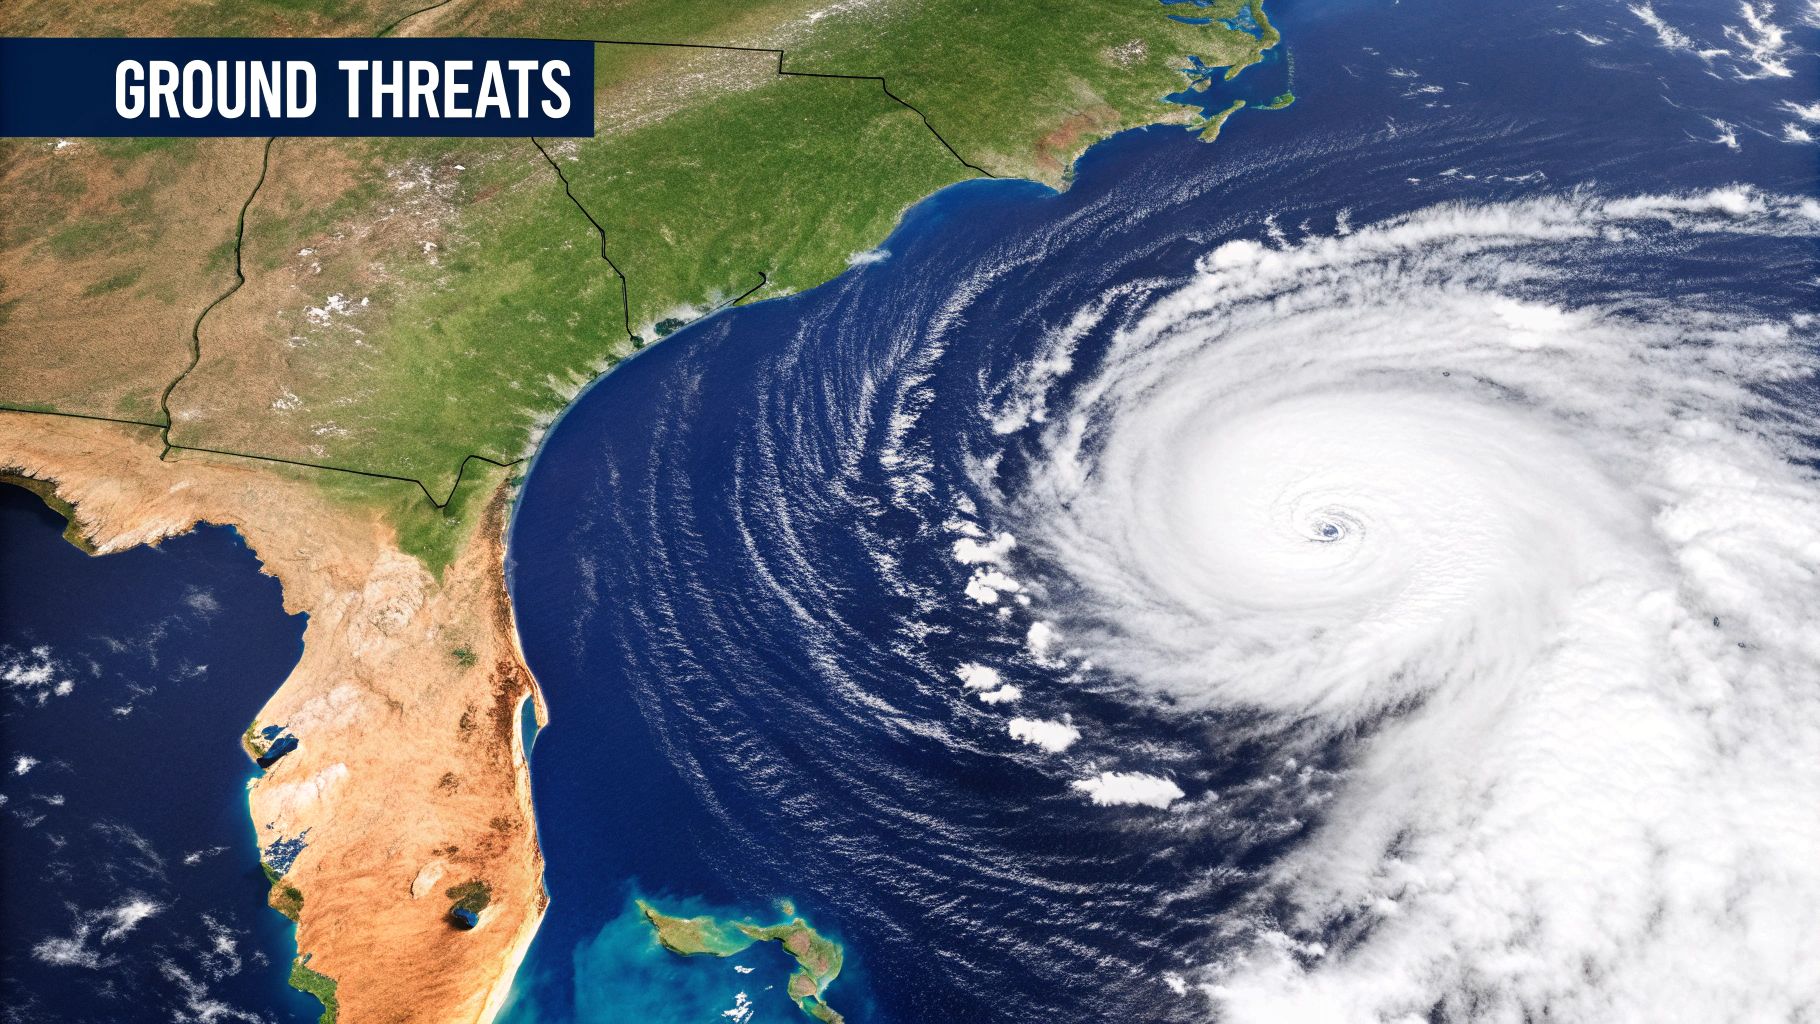
From high above, a satellite view of a hurricane shows a stunning, terrifying spiral of clouds and thunderstorms. The sheer scale is hard to grasp. Right at the center, you'll often see a strangely calm, cloud-free circle—that’s the eye. It's wrapped by the eyewall, which contains the most ferocious winds and heaviest rains the storm has to offer. For business leaders, understanding this image is not just about meteorology; it's about operational risk assessment.
The Anatomy of a Hurricane: A Visual Breakdown for Risk Management
When you see a hurricane spinning on a weather map, you're not looking at a single, uniform blob of bad weather. You're looking at a highly organized, powerful engine with distinct, moving parts. For Texas industries—from manufacturing and logistics to energy and construction—understanding this structure is the first step in assessing real operational risk.
Each component carries a different threat profile. Knowing what you're looking at transforms a satellite image from a weather report into a roadmap of potential impacts. This is a fundamental piece of the puzzle for preparing your business operations for an approaching storm.
The Core Components of a Hurricane
You can break a hurricane's structure down into three main zones. This simple visual guide shows how they all fit together.
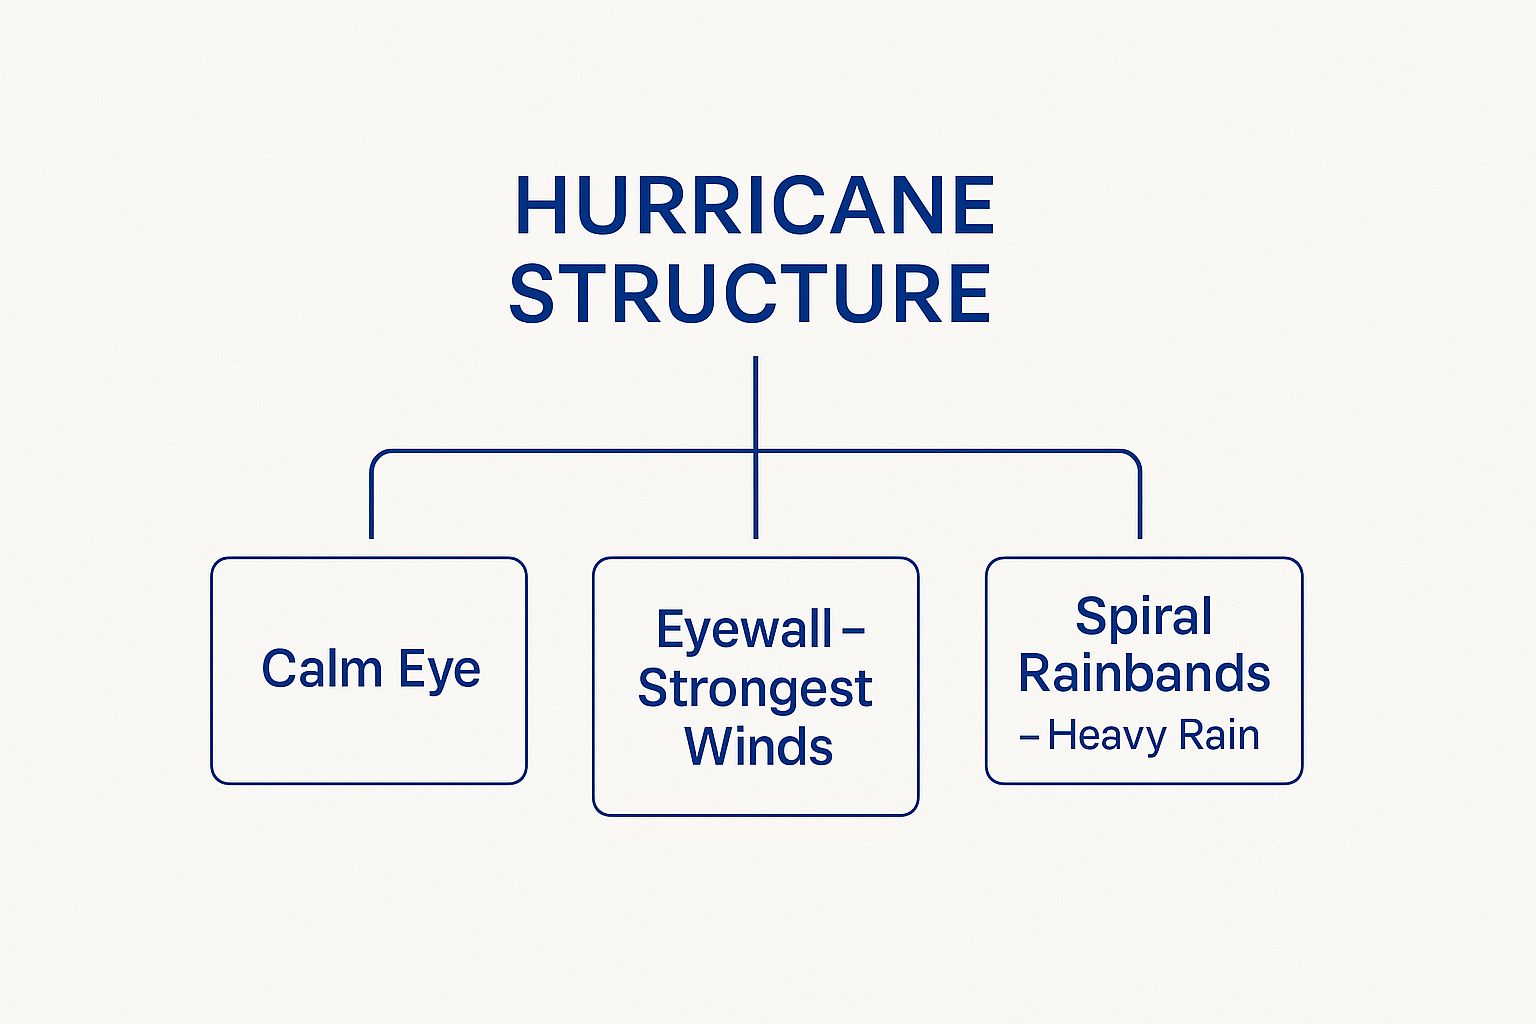
The diagram makes it clear: the quiet eye is encircled by the violent eyewall, with the sprawling spiral rainbands extending outward.
The most critical error in risk assessment is mistaking the brief calm of the eye for the end of the storm. The most destructive winds immediately follow as the back side of the eyewall passes over, a critical consideration for on-site personnel safety and post-storm damage assessment protocols.
This satellite image from NOAA shows what these components look like in the real world. You can clearly see the well-defined eye and the dense, powerful clouds of the eyewall—a perfect illustration of the storm's organized power.
Each part presents a different set of challenges for your business:
- The Eye: This is the deceptively calm, low-pressure center of the storm. Winds here are light. Its passage over your facility means you are dead center in the zone of maximum impact and will face the second half of the eyewall imminently.
- The Eyewall: A brutal ring of severe thunderstorms hugging the eye. This is where you'll find the hurricane's most destructive winds. It poses a direct, physical threat to industrial infrastructure, construction sites, and agricultural facilities.
- Spiral Rainbands: These are the long arms of heavy rain and gusty winds that can stretch for hundreds of miles from the storm's center. These bands are often the primary cause of widespread, catastrophic flooding, capable of disrupting supply chains and swamping manufacturing plants long before—and long after—the eyewall arrives.
These components don't form by accident; they're the product of very specific atmospheric forces. To get the full picture, you can dive deeper into what conditions are needed for hurricanes to form in our detailed guide.
To better connect these visual cues to tangible business threats, here’s a quick-reference table for Texas industries.
Hurricane Components and Their Business Threats
| Hurricane Component | Visual Characteristic | Primary Threat to Texas Industries |
|---|---|---|
| The Eye | A calm, clear, circular area at the storm's center. | A false sense of security. Its arrival signals the halfway point of the eyewall's passage and imminent danger from the second half of the storm. |
| The Eyewall | A dense, thick ring of thunderstorms immediately surrounding the eye. | Extreme wind damage to structures, roofs, and equipment. Widespread power outages and destruction of physical assets. |
| Spiral Rainbands | Long, curving bands of clouds and rain extending far from the center. | Widespread inland flooding, disrupting transportation logistics, flooding facilities, and causing long-term operational delays. |
By breaking down the storm into its parts, you can more accurately forecast the specific types of damage your operations might face, allowing for more targeted and effective preparation.
Disclaimer: ClimateRiskNow does not sell insurance or financial products. The information provided is for educational and risk management purposes only and should not be interpreted as financial advice.
Visualizing Hurricane Intensity Beyond the Category Number
A hurricane’s category is much more than just a number; it’s a direct measure of its power and a preview of what things will look like on the ground. For Texas business leaders, being able to translate these categories into real-world operational impacts is a non-negotiable part of risk management. A Category 1 might mean some cosmetic damage, but a Category 5 signifies a fight for operational survival.
This visual progression is critical for making informed decisions about protecting your assets and, more importantly, your people. The Saffir-Simpson Hurricane Wind Scale gives us a framework for this, linking wind speeds to observable damage. Hurricane Camille in 1969, for instance, was a monster Category 5 at landfall, and the catastrophic damage it left across the Gulf Coast was a stark visual testament to that rating. For Texas, the memory of Hurricane Harvey in 2017 underscores that even a storm that weakens in wind speed can produce catastrophic flooding, disrupting the petrochemical and logistics sectors for weeks.
Translating Categories into On-the-Ground Impacts
Visualizing the threat is how you close the gap between abstract weather data and a solid business continuity plan. Every step up the scale means a dramatic escalation in potential damage to your facilities, equipment, and supply lines.
Category 1 (74-95 mph winds): At this stage, the damage is mostly superficial. Think torn-off commercial signs, peeled-back roofing materials on warehouses, and downed power lines that snarl local logistics for a short time.
Category 2 (96-110 mph winds): The visual impact gets more serious here. You’re now looking at significant roofing and siding damage to industrial buildings. Uprooted trees will start blocking key transportation routes, creating delays that can last for days.
A Category 3 storm is where we cross the threshold into major, widespread destruction. Once a storm hits this intensity, preparation strategies must shift fundamentally—you’re no longer just securing loose items, you’re reinforcing the core structure of your assets.
Category 3 (111-129 mph winds): Now you’ll see obvious structural damage to manufacturing plants and distribution centers. Any improperly secured heavy equipment is at risk. Power and water outages can become widespread and last for weeks, crippling operations.
Categories 4 & 5 (130+ mph winds): The scene becomes one of catastrophic failure. Even well-built industrial buildings will lose their roofs and some exterior walls. Critical infrastructure—from major highways to communication systems—will be destroyed, leading to long-term operational paralysis.
This visual framework, especially when paired with insights from modern forecasting tools, gives you a far more complete picture of your risk. You can get a better sense of this by exploring our guide on how weather maps are defined and used in professional analysis.
Why Storm Size and Speed Change the Entire Picture
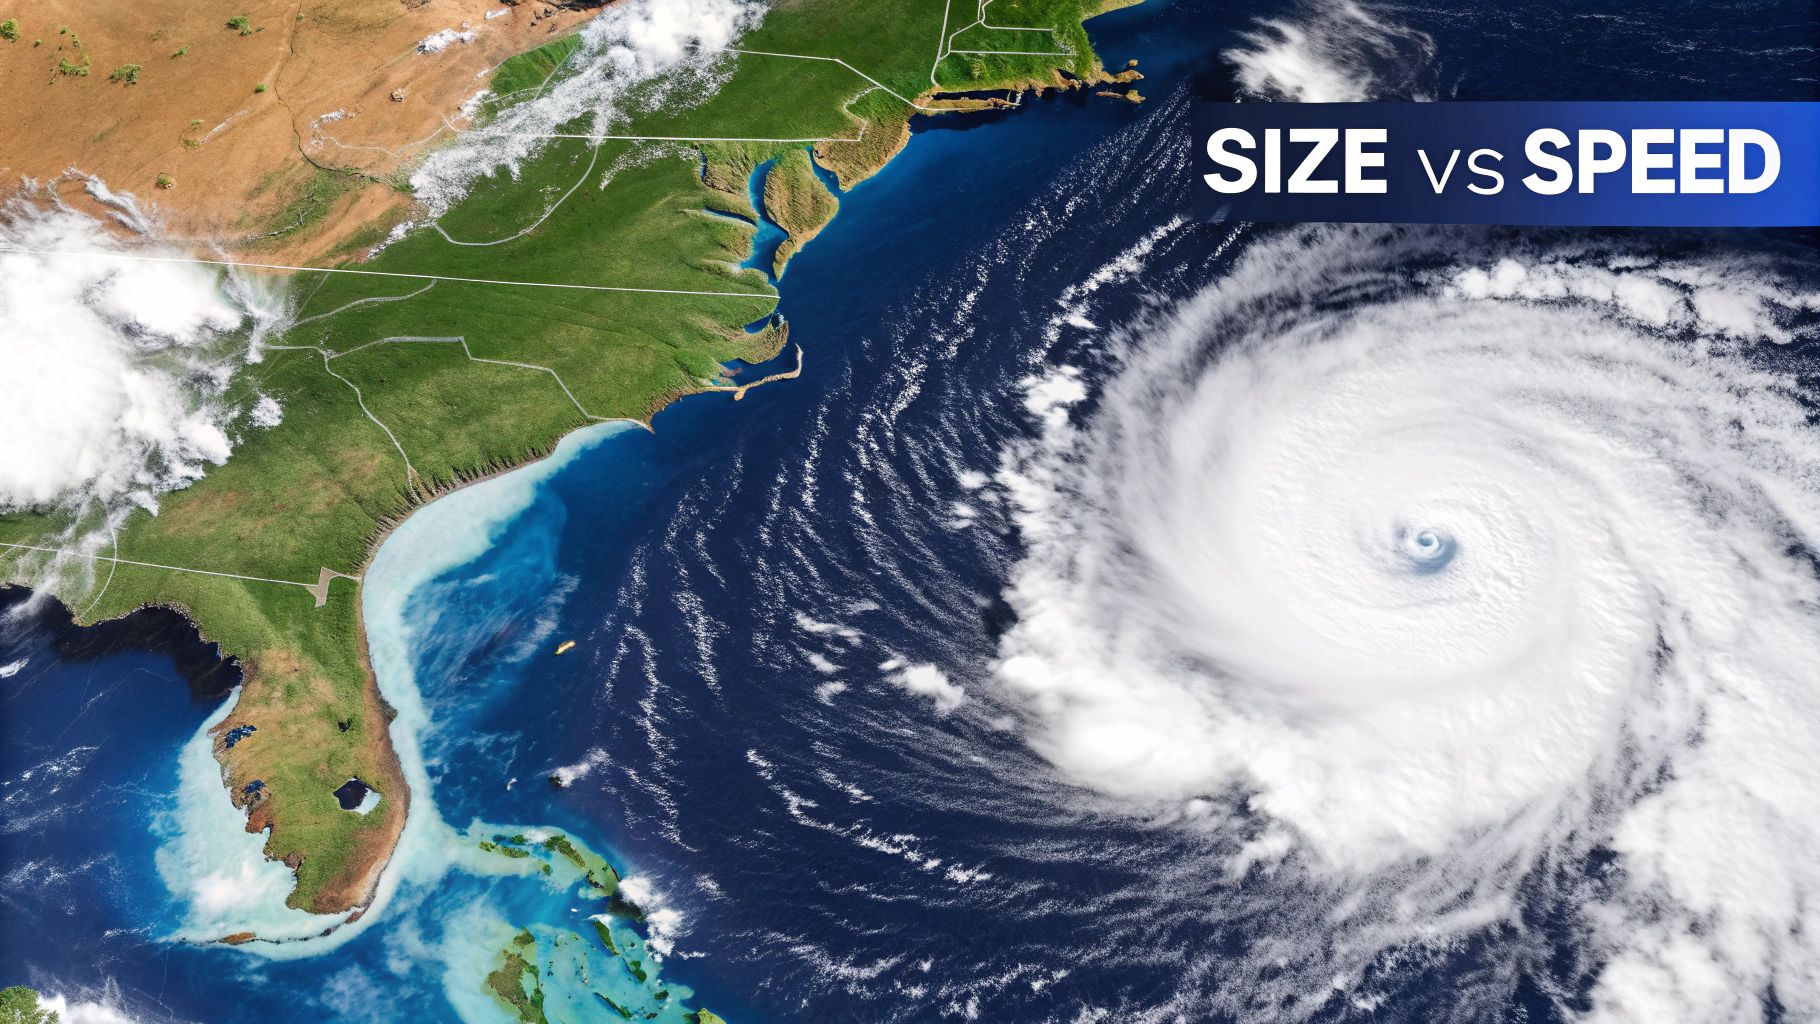
You can have two hurricanes with the exact same category rating, yet they pose completely different threats to your operations. Once you look past the headline wind speed, two of the most critical factors you can spot on a satellite map are the storm’s physical size and its forward speed.
Together, these two variables dictate the nature, duration, and severity of the impact on your business.
A massive, slow-moving hurricane is a recipe for operational paralysis. Its sprawling rainbands can sit over a region for days, leading to catastrophic flooding that swallows key highways and cuts off facility access for weeks. Hurricane Harvey in 2017 is the textbook Texas case study—it stalled over Southeast Texas, dropping over 60 inches of rain in some areas, causing an estimated $125 billion in damages and crippling the petrochemical industry.
On the other hand, a smaller, faster storm delivers a much more concentrated, violent punch. The damage is less about widespread flooding and more about extreme winds that threaten the structural integrity of buildings, industrial equipment, and agricultural facilities in a much shorter, more intense timeframe.
Size and Speed Scenarios
The visual footprint of a hurricane gives you direct clues about the specific business risks you're facing.
Large, Slow Storm (e.g., 5-7 mph forward speed): This scenario is all about flood mitigation. For a logistics company, it means rerouting supply chains days ahead of time. For a manufacturer, it’s a signal to elevate critical equipment and prepare for extended downtime because roads will be impassable.
Small, Fast Storm (e.g., 15-20 mph forward speed): Here, the main concern is destructive wind. Construction sites have to scramble to secure materials and cranes. Energy facilities need to brace for widespread grid failure. The disruption might be shorter, but it's often far more intense. The nuances of these winds are critical, as we explore in our guide on how wind is measured and its impact.
A hurricane's visual appearance is fundamentally tied to its size. Some storms are tiny—Tropical Storm Marco in 2008 had winds extending just 11.5 miles from its center. But larger systems like Hurricane Ivan in 2004 spawned over 120 tornadoes, a perfect illustration of how a larger footprint can amplify secondary threats.
Translating Satellite Images into Ground-Level Threats
A satellite gives you that crucial bird's-eye view, but what do those swirling clouds really mean for your facilities on the ground? For business leaders in Texas, the ability to translate weather data into actionable intelligence is everything. It’s about looking at those satellite and radar loops and knowing exactly which visual cues signal specific, imminent threats.
This isn't just about knowing a storm is coming. It's about understanding how its behavior will impact your specific assets. An eye that starts to "wobble" on the forecast track, for instance, tells you the zone of catastrophic winds is shifting. A previously "safe" facility could suddenly be in the direct path of the storm's worst, demanding an immediate re-evaluation of on-site preparations.
From Pixels to Preparedness
Understanding what you see on a radar or satellite loop allows your team to anticipate ground-level conditions with far greater precision. The colors on a radar display are especially critical. Those brightest shades—often angry reds and purples—pinpoint extreme rainfall rates that can trigger life-threatening flash floods in minutes, overwhelming drainage systems and cutting off vital transportation routes.
A classic, and dangerous, visual indicator is the formation of a secondary eyewall. This "eyewall replacement cycle" is often a tell-tale sign that the hurricane is about to undergo rapid intensification. That means a Category 2 storm could quickly explode into a Category 4.
This ability to connect imagery to real-world impact is where risk management shifts from reactive to proactive. It turns your team from passive observers into strategic decision-makers who can act before the worst conditions arrive. This data-driven approach is a cornerstone of modern forecasting, which we cover in our deep dive on how weather computer models work.
Interpreting Visual Cues from Weather Data
The table below breaks down these visual cues, connecting the satellite and radar imagery features to the actionable operational insights your business needs to make critical, time-sensitive decisions.
| Visual Cue (Satellite/Radar) | What It Means Meteorologically | Actionable Insight for Your Business |
|---|---|---|
| A "wobbling" or shifting eye | The storm's core track is slightly unpredictable. | The zone of maximum wind damage is moving; re-assess which assets are in the direct path. |
| Formation of a secondary eyewall | The storm is reorganizing and will likely intensify rapidly. | Expect conditions to worsen significantly faster than previously forecast; accelerate final preparations. |
| Bright red/purple rainbands | Indicates extremely high rainfall rates. | Anticipate immediate flash flooding; ensure personnel and vehicles are clear of low-lying areas and critical routes. |
By learning to read these signs, you can stay one step ahead, making informed decisions that protect both your people and your physical assets from the storm's full force.
Using Past Storm Tracks to Predict Future Risks
While satellite imagery gives us a real-time snapshot of a hurricane, its history—the path it took—is where the real predictive power lies. For anyone managing industrial assets in Texas, digging into past storm tracks isn’t just an academic exercise. It's a fundamental part of strategic planning that shapes everything from where you build to how you secure your supply chain.
By looking at the paths of storms over decades, we can spot patterns. A storm that spins up in the Gulf of Mexico and hooks north, for example, poses a completely different threat profile than one that travels thousands of miles across the Atlantic before hitting the coast. These historical tracks give us a data-backed starting point for knowing what to expect next.
Decoding Historical Hurricane Paths
Looking at recorded storm paths is one of the clearest ways to visualize how hurricanes behave over time. We have a surprisingly deep well of data to draw from—over 13,000 storm tracks have been documented worldwide since 1842. The North Atlantic alone has seen an average of six to seven hurricanes each year since 1878, creating an incredibly rich dataset for risk analysis. You can dive into this history yourself on the NOAA website.
Just look at Hurricane Harvey (2017) versus Hurricane Ike (2008). Harvey’s slow, meandering crawl inland dumped catastrophic amounts of rain, leading to historic flooding. Ike, on the other hand, was a direct hit that generated a massive storm surge, crippling coastal infrastructure.
These are the case studies that Texas business leaders need to understand inside and out. They show a direct line between a storm’s path and the specific damage it causes on the ground, which allows for much smarter preparation.
By studying these past events, you can get a better feel for whether your biggest threat is wind, surge, or inland flooding based on a storm's projected track. That historical context is what turns a weather forecast into actionable intelligence for protecting your assets and maintaining operational continuity.
From Watching to Winning: Putting Insights into Action
Seeing a hurricane on a satellite image is one thing. Understanding what those swirling clouds mean for your operations on the ground is where real risk management begins.
When you can look at a storm’s structure, its size, and its speed and translate that into specific threats to your facilities, you’re no longer just watching the weather—you’re getting ahead of it. This is how you build a robust business continuity plan that protects your people, your assets, and your bottom line.
This guide was designed to bridge that gap, connecting the visual signatures of a storm to the real-world impacts felt across Texas industries. The goal isn’t perfect prediction; it’s intelligent preparation. Use these insights to arm your risk management team and start building a more resilient operation today.
A quick but important note: ClimateRiskNow does not sell insurance or financial products. Our goal is to provide information for educational and risk management purposes only. This should not be taken as financial advice.
This visual analysis is a powerful piece of a much larger puzzle. To take the next step, see our detailed guide on how to prepare for hurricanes and turn this knowledge into a concrete action plan.
Frequently Asked Questions
Seeing a hurricane on a satellite map is one thing, but for business leaders, the real question is how those visuals translate into tangible operational risks. Here are a few of the most common questions we hear from Texas industries.
Why Does the Eye of the Hurricane Matter for My Facility?
The eye might look like a calm reprieve, but it's bordered by the eyewall—the single most destructive part of the storm. If the eye passes directly over your facility, you're not just getting hit once; you're getting hit twice.
You'll experience the ferocious winds of the leading edge of the eyewall, followed by a brief, eerie calm as the eye passes over. Then, the trailing edge of the eyewall hits, often with even greater force. Mistaking the calm for the end of the storm is a critical, and often dangerous, operational error.
A common mistake is sending teams out to assess damage the moment the winds die down. This exposes them to the immense danger of the eyewall’s second half, which arrives with little warning and maximum force.
Can a Small-Looking Hurricane Still Cause Major Damage?
Absolutely. A hurricane's size on a satellite image is a poor indicator of its destructive power. Some of the most ferocious storms are compact "pinhole" eye hurricanes, which pack devastating Category 4 or Category 5 winds into a tight, focused area.
Beyond wind, factors like the storm's forward speed and the unique geography of the Texas Gulf Coast can create catastrophic storm surge and flooding, no matter how big the storm looks. A complete risk assessment must go beyond the satellite footprint and look at the storm's category, speed, and your facility's local vulnerabilities.
How Do I Use Storm Visuals for Better Logistics Planning?
Satellite and radar imagery are indispensable tools for logistics. By watching the size and movement of the outer rainbands, you can anticipate which transportation corridors will flood and, just as importantly, when.
A large, slow-moving system is a clear signal of widespread, prolonged road closures. This insight allows you to reroute shipments and secure vehicle fleets days ahead of time. Tracking the storm's forward speed also helps you make timely calls on moving assets out of low-lying areas, preventing them from being flooded, damaged, or stranded.
ClimateRiskNow provides location-specific weather risk intelligence to help Texas businesses translate complex meteorological data into strategic risk management decisions. Our Sentinel Shield assessments empower you to safeguard assets, optimize resilience, and ensure operational continuity.
Discover how to protect your operations by exploring our services at https://www.climaterisknow.com.