
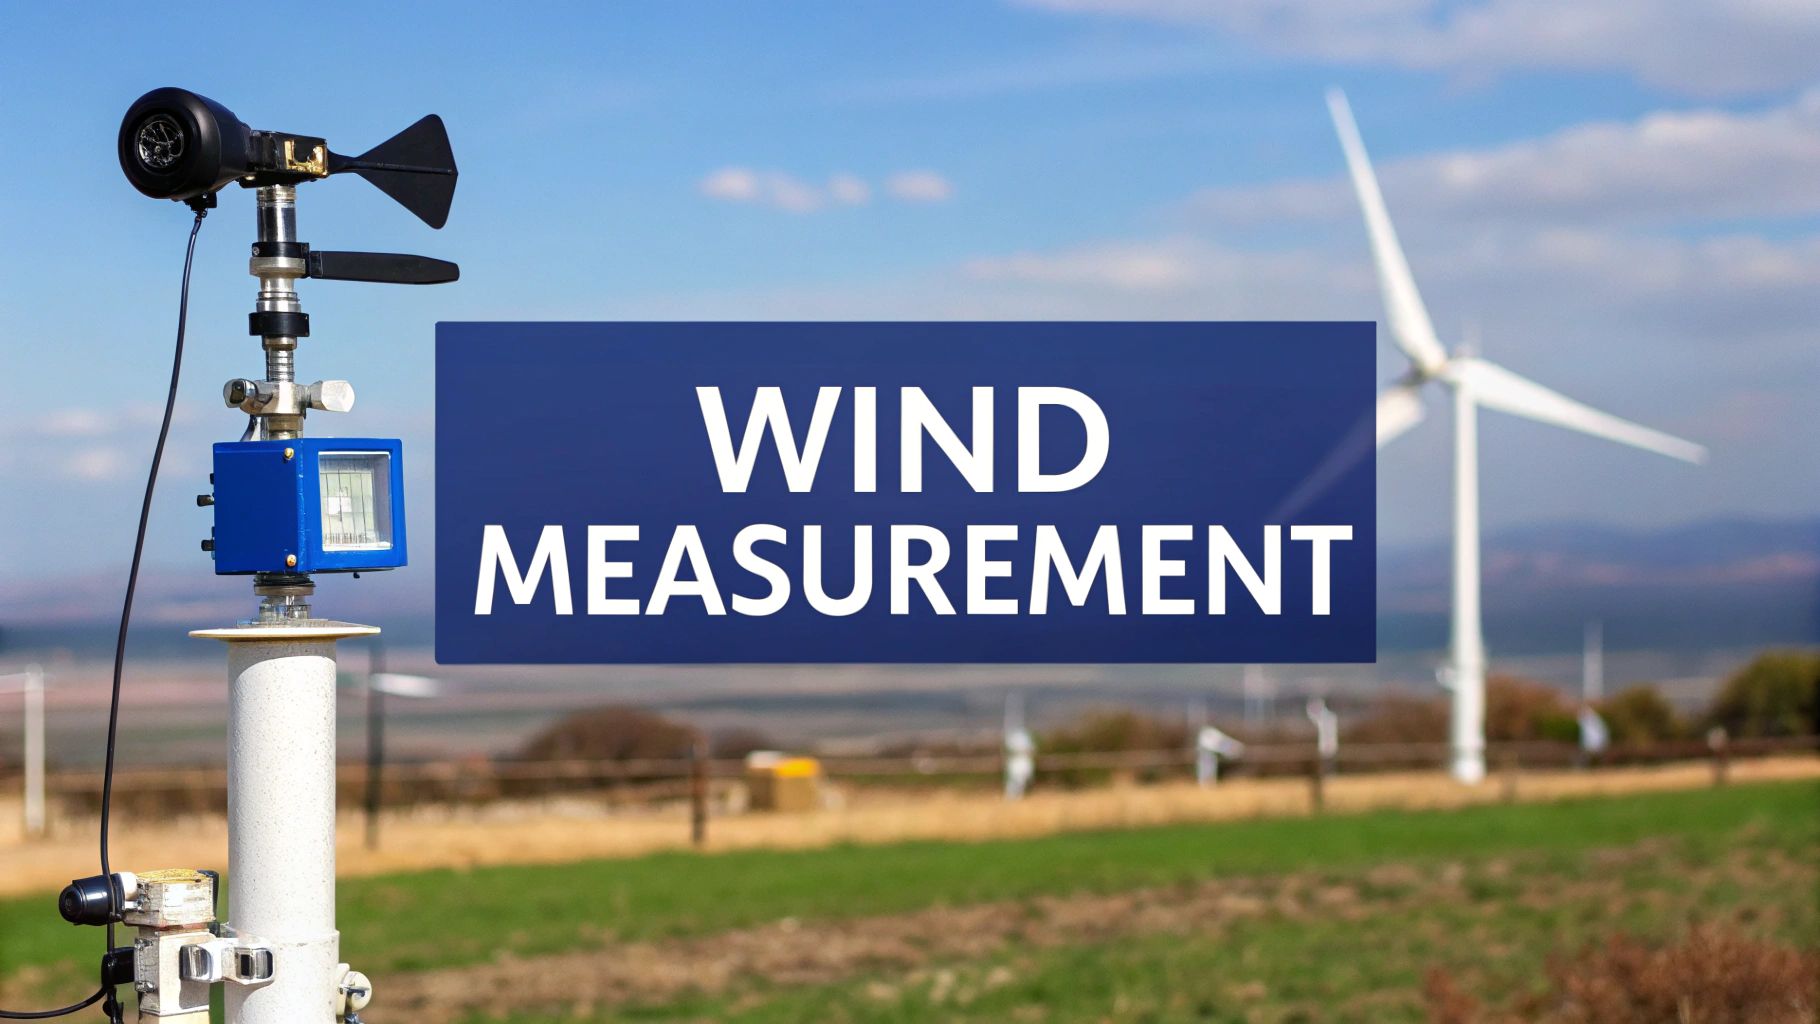
Wind is measured using two primary metrics: speed, captured by an anemometer, and direction, identified by a wind vane. These traditional instruments provide essential ground-level data. However, for a comprehensive analysis critical to industrial operations, advanced remote sensing technologies like Doppler LIDAR are employed to map complex wind patterns across large areas and at various altitudes, turning atmospheric movement into actionable data for risk management.
For business decision-makers, understanding these measurements is the first step toward transforming a powerful force of nature into a manageable operational variable.
Why Measuring Wind Is Critical for Operational Risk Management
For Texas industries—from petrochemical complexes on the Gulf Coast to logistics hubs in Dallas and agricultural enterprises in the Panhandle—precise wind measurement is a cornerstone of operational risk management. High winds can halt construction cranes, overturn high-profile vehicles, disrupt agricultural spraying, or force shutdowns at energy facilities. Ignoring this variable invites avoidable financial losses and significant safety hazards.
Accurate wind data allows business leaders to make proactive, data-driven decisions that protect assets, ensure personnel safety, and maintain supply chain integrity. For example, granular data on potential wind gusts determines whether a multi-million-dollar crane lift proceeds or is postponed, mitigating the risk of catastrophic failure. This approach is essential for building operational resilience in a state known for its dynamic weather. A range of analytical resources to support this is detailed in our guide to climate risk assessment tools.
From Weather Data to Business Strategy
The destructive potential of extreme wind events underscores the importance of robust measurement. In 1996, Tropical Cyclone Olivia produced the fastest non-tornadic wind gust ever recorded: an astonishing 253 mph (408 km/h). While such events are rare, this serves as a critical reminder that relying on "average" wind speed forecasts is insufficient for comprehensive risk planning. You can read more about this record-breaking meteorological event and its implications for measurement technology.
High winds present specific, tangible risks that can halt operations, damage capital equipment, and impact revenue. For Texas businesses, identifying these vulnerabilities is the first step toward effective mitigation.
Wind-Related Operational Risks Across Key Texas Industries
The following table outlines how wind events can directly impact core business functions across the state's vital economic sectors.
| Industry Sector | Primary Operational Risk Example | Potential Business Impact |
|---|---|---|
| Energy & Petrochemical | Halting of flaring operations or crane lifts due to high wind speeds. | Production delays, project cost overruns, catastrophic equipment failure, and regulatory compliance issues. |
| Construction | Work stoppages for high-rise projects; risk of falling materials or scaffolding failure. | Missed project deadlines, increased insurance premiums, and severe safety incidents. |
| Logistics & Transportation | High-profile vehicle rollovers on corridors like I-10 and I-35; port and terminal closures. | Supply chain disruption, damaged cargo, highway closures, and loss of life. |
| Agriculture | Inability to conduct aerial spraying; damage to crops and irrigation systems from high winds. | Reduced crop yields, financial losses, and damaged infrastructure. |
| Manufacturing | Damage to large structures and roofing; disruption of outdoor logistics (loading/unloading). | Facility downtime, costly repairs, and supply chain bottlenecks. |
By converting raw wind data into actionable intelligence, Texas businesses can prepare for everything from daily operational adjustments to severe weather emergencies, securing their competitive advantage in a volatile environment.
Disclaimer: ClimateRiskNow does not sell insurance or financial products. The information provided is for educational purposes only to help business leaders make informed decisions.
The Essential Tools for Measuring Wind
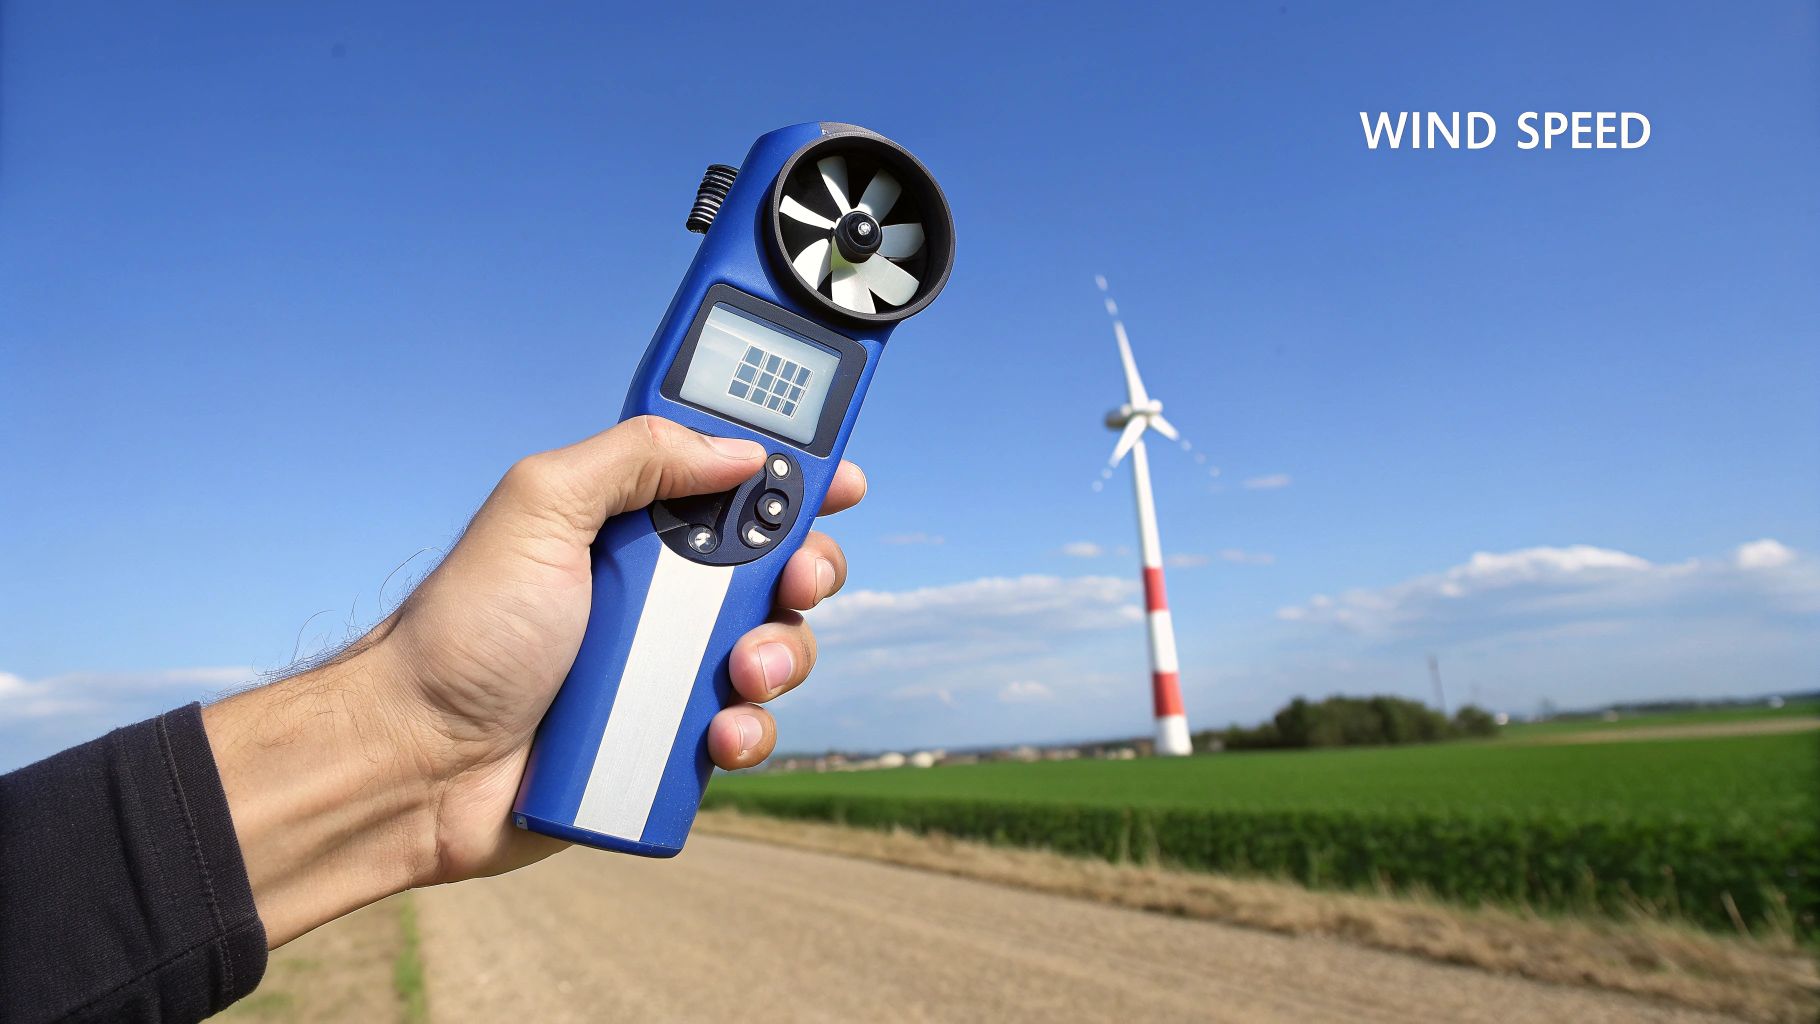
For a Texas business leader, understanding the mechanics of wind measurement is the first step in converting raw weather data into actionable business intelligence. The primary tool for this is the anemometer, which functions as a speedometer for the wind.
For decades, the most common instrument has been the cup anemometer. Its design is simple and effective: three or four cups catch the wind, causing a central axis to rotate at a speed proportional to the wind's velocity. This classic design has been a reliable standard for on-site data collection for nearly a century.
From remote agricultural monitoring stations to sprawling industrial facilities, the cup anemometer's robust mechanical nature makes it a durable and dependable choice for consistent, long-term monitoring.
Modernizing Wind Measurement
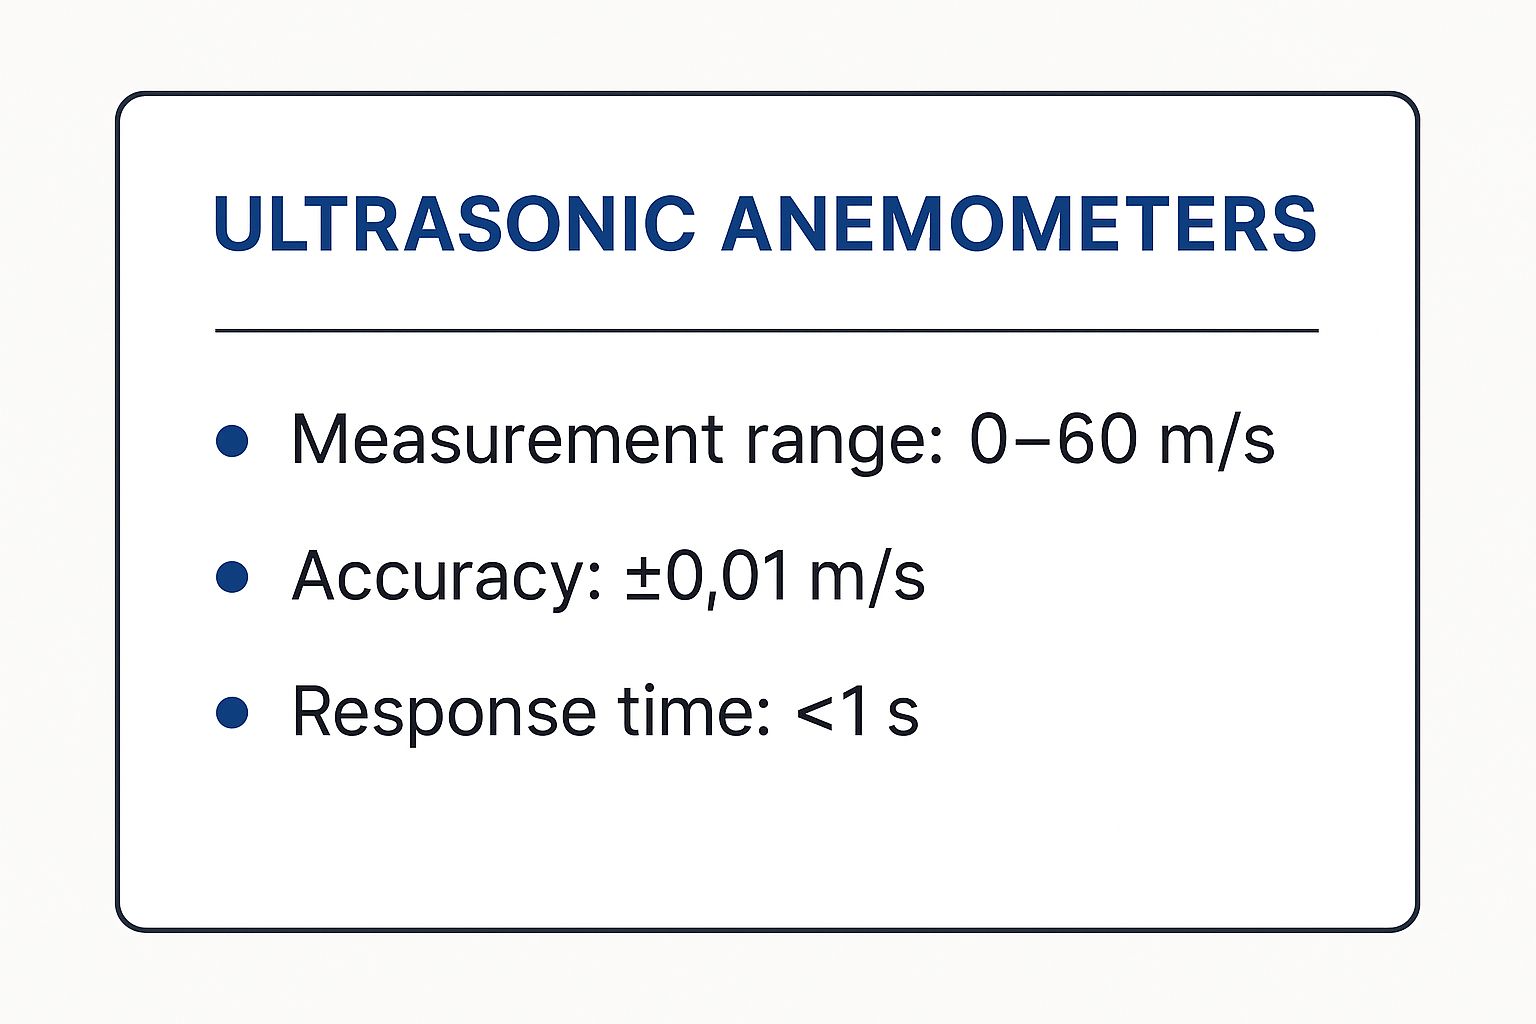
While the cup anemometer remains prevalent, modern industrial operations often demand higher precision. This is where sonic anemometers provide a significant technological advantage. Instead of mechanical cups, these advanced sensors use ultrasonic sound waves to measure both wind speed and direction without any moving parts.
The device sends ultrasonic pulses between its sensors. Wind moving along the path of a pulse either accelerates or decelerates it. By measuring these minute time differences, the instrument calculates wind speed and direction with exceptional accuracy. For high-stakes industries in Texas, this technology offers critical benefits:
- Greater Precision: They detect subtle wind shifts that mechanical systems can miss.
- Enhanced Durability: With no moving parts to wear out or freeze, they offer superior reliability, particularly in icing conditions.
- Instantaneous Readings: They provide the real-time data essential for dynamic operations like crane lifts, port logistics, and flaring operations.
From Speed to Direction
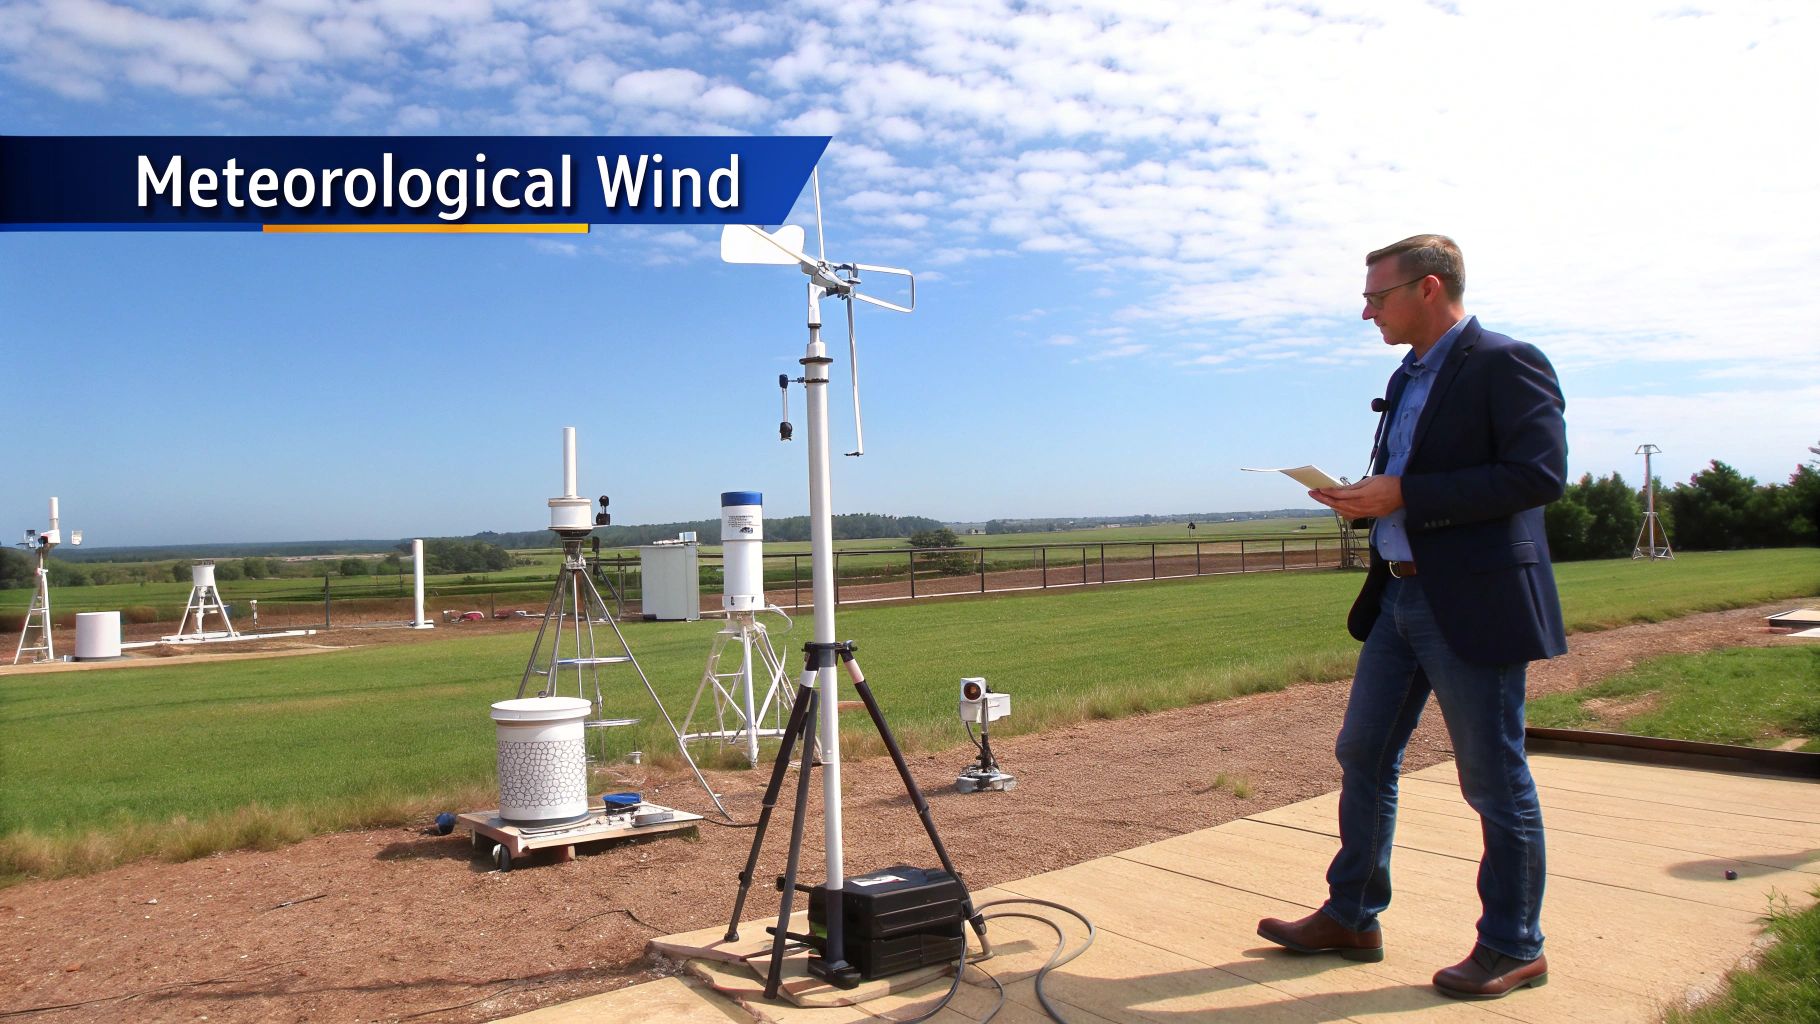
Knowing wind speed is only half the equation. A wind vane is required to determine its direction. These arrow-shaped instruments pivot freely to point into the wind, indicating its origin.
When data from an anemometer (speed) and a wind vane (direction) are combined, they form a complete, fundamental wind profile. This dataset is the minimum requirement for any effective wind-related operational risk assessment.
This data collection method has a proven history. The cup anemometer, invented in 1926, revolutionized wind speed tracking. Since approximately 1940, wind direction data has been recorded with increasing accuracy. Modern systems typically report wind speed as a time-averaged value (e.g., over two minutes) while also capturing gusts—the short, powerful bursts that often cause the most significant damage. You can learn more about how experts capture and interpret historical wind data to build a more complete risk profile.
Seeing the Invisible with Remote Sensing Technology
While ground-level instruments provide an essential point-specific measurement, many significant operational risks originate from wind patterns high above the surface. These atmospheric dynamics can steer a hurricane, influence air quality compliance, or create hazardous conditions for aviation and high-rise construction.
This is where remote sensing technology offers a decisive advantage for strategic planning.

Advanced tools like Doppler Light Detection and Ranging (LIDAR) and Sonic Detection and Ranging (SODAR) function like a weather radar for wind. They build a detailed, three-dimensional profile of wind speed and direction from the ground up into the atmosphere. These systems emit pulses of energy (light for LIDAR, sound for SODAR) that reflect off airborne particles. By measuring the frequency shift in the returning signal (the Doppler effect), the technology calculates wind velocity at various altitudes.
Actionable Insights from Above
For a Texas decision-maker, this vertical wind profile is a source of critical operational intelligence that informs large-scale planning and risk mitigation in ways a single ground-based sensor cannot. This broader perspective is vital when preparing for major weather events like hurricanes, where upper-level wind shear is a key factor in forecasting intensity and trajectory. More strategies are available in our hurricane season preparation checklist.
Practical applications across key Texas industries include:
- Logistics and Aviation: At major hubs like DFW Airport or the Port of Houston, these tools detect wind shear—a sudden, dangerous change in wind speed or direction over a short distance. Early detection is crucial for the safety of aircraft and high-profile vehicles.
- Energy and Petrochemical: A coastal refinery can use LIDAR data to model the dispersion of airborne emissions under various atmospheric conditions, informing emergency response plans and ensuring compliance with Texas Commission on Environmental Quality (TCEQ) regulations.
- Renewable Energy: Before developing a new wind farm in West Texas, companies use LIDAR to map wind resources up to turbine height. This data validates site viability and optimizes turbine placement for maximum energy generation and financial return.
By providing a complete atmospheric profile, remote sensing transforms how businesses assess and prepare for wind-related risks. It moves beyond a single data point on the ground to a dynamic, multi-layered understanding of a complex environmental factor.
Ultimately, understanding how wind behaves at every level empowers Texas companies to build more resilient operational strategies, leading to smarter site selection, safer procedures, and more accurate forecasting.
Turning Wind Data Into Business Intelligence
Raw sensor data is of little value until it is translated into intelligence that informs operational decisions. For business leaders in Texas, the objective is to understand the context behind the numbers. A wind speed of 30 mph is meaningless without knowing if it is a steady breeze or a series of violent gusts. Effective risk management requires using established frameworks to assess what the data means for your specific operations.
Sustained Winds vs. Dangerous Gusts
A critical distinction in wind analysis is between sustained winds and gusts.
Sustained winds represent the average speed over a defined period, typically two minutes. This is the baseline force exerted on structures and operations. However, the most acute risks often come from wind gusts—sudden, brief spikes in speed that can topple cranes, damage infrastructure, and create projectiles.
For a construction manager overseeing a project in Dallas, a sustained wind of 20 mph might be manageable. But if the forecast includes gusts of 45 mph, the operational risk profile changes entirely. This sudden force is what compromises crane stability or turns loose materials into dangerous projectiles. In this scenario, gust data becomes the determining factor for a work stoppage to ensure site safety.
Another key metric is the prevailing wind—the dominant wind direction for a location over a long period. For an agricultural business in the Panhandle, this historical data is a strategic asset. It informs the orientation of buildings to minimize wind load and the placement of shelterbelts to protect valuable crops and prevent soil erosion. This is a move from reactive daily decisions to proactive, resilient design.
Standardizing Wind Impact Assessment
To translate raw data into a clear operational threat level, industries rely on standardized scales. These frameworks provide a common language for describing wind severity.
A logistics coordinator in Houston and a plant manager in Austin can use these scales to interpret the same forecast and understand the operational threat consistently, enabling coordinated planning during widespread weather events.
Two of the most widely used scales are:
- The Beaufort Wind Scale: This scale relates wind speed to observable conditions. A "strong breeze" (25-31 mph) is defined by the movement of large tree branches, providing a practical visual reference for ground crews to understand wind power without consulting a sensor.
- The Saffir-Simpson Hurricane Wind Scale: This scale is essential for any business on the Texas Gulf Coast. It categorizes hurricanes from 1 to 5 based on maximum sustained wind speeds, providing a clear forecast of potential property damage. A Category 3 storm (111-129 mph winds) indicates that "devastating damage" is likely—an unambiguous signal to activate emergency protocols and protect assets.
Understanding these metrics is non-negotiable for extreme weather preparedness. The Texas energy sector, for example, learned from Winter Storm Uri how critical it is to use weather data to inform resilience planning. By mastering these concepts, Texas decision-makers can use meteorological data as a powerful tool to safeguard assets, protect personnel, and build a more resilient business.
Applying Wind Data to Your Risk Management Strategy
Knowing how wind is measured is foundational. The critical next step is to integrate that meteorological data into a proactive operational risk management strategy. For businesses across Texas, this means embedding precise wind analytics into standard operating procedures (SOPs), emergency action plans, and long-term capital investment decisions. This is not just about preparing for an annual hurricane but about making smarter, safer, data-driven decisions daily. The goal is to achieve operational resilience that reduces downtime, protects assets, and ensures personnel safety.
From Theory to Texas-Based Practice
The application of wind data varies by industry, but the objective of mitigating risk remains constant. Consider these practical, Texas-based scenarios:
Houston Logistics: A freight company operating out of the Port of Houston uses real-time wind gust forecasts to guide routing. If gusts are predicted to exceed 45 mph along an exposed section of I-10, it can reroute high-profile trucks or delay departure. This data-driven decision prevents dangerous rollovers that can disrupt supply chains and cause significant safety incidents.
Panhandle Agriculture: A large-scale cotton farm near Lubbock uses historical prevailing wind data to implement soil conservation strategies. By planting windbreaks and aligning crop rows with the dominant wind direction, the farm significantly reduces topsoil erosion, protecting the long-term productivity and value of its land.
Austin Construction: A project manager for a new high-rise in Austin uses on-site anemometer readings to govern crane operations. The company's safety policy mandates that all lifts cease when sustained winds reach 25 mph or gusts exceed 35 mph. This is a non-negotiable rule, based on live data, that prevents catastrophic equipment failure.
Embedding Wind Data into Your Framework
For these protocols to be effective, they must be formally integrated into a company's operational risk management framework. This ensures that actions are consistent, documented, and understood by all personnel. A robust strategy makes data a core component of decision-making.
When wind measurement is transformed from a passive weather report into an active operational input, an organization creates a system that anticipates risks instead of merely reacting to them. This shift is fundamental to building a truly resilient business.
Integrating this data is a key component of managing physical threats to your operations. For more on this topic, read our detailed guide on what is operational risk management. The science of measuring wind provides the essential data, but it is the consistent application of this data within your SOPs and strategic planning that builds a more secure and profitable future for your Texas operations.
Disclaimer: ClimateRiskNow does not sell insurance or financial products. The information provided is for educational purposes only to help business leaders make informed decisions.
Building Your Weather Preparedness Plan
Understanding how wind is measured is the first step. Translating that knowledge into a robust preparedness plan is what ultimately protects your business. The measurement tools and data available today provide the intelligence needed to manage wind as a quantifiable operational risk. For any enterprise in Texas, proactively addressing these risks is fundamental to maintaining safety, efficiency, and long-term profitability.
This guide provides the foundational knowledge to build a comprehensive weather risk strategy. By integrating both real-time and historical wind data into your planning, you can make smarter, faster decisions that protect your assets and personnel.
Disclaimer: ClimateRiskNow provides educational content to support business leaders in their risk management efforts. We do not sell insurance or financial products, and the information provided should not be interpreted as financial advice.
This data-driven approach is critical when facing the severe weather events common in Texas. For a detailed guide on securing your operations against major wind-related threats, see our actionable plan on how to prepare for hurricane season.
Wind Measurement: Your Questions Answered
For business leaders across Texas, understanding the specifics of wind measurement is crucial for protecting operations. Here are answers to common questions about the tools, data, and their bottom-line impact.
What Is the Best Instrument for Our Needs?
The optimal tool depends on the specific operational requirement.
For general situational awareness at a construction site or agricultural operation, a classic cup anemometer and wind vane is a durable and reliable solution. It provides essential speed and direction data sufficient for many daily operational decisions.
For high-stakes environments like petrochemical plants, port terminals, or airports where precision is paramount, a sonic anemometer is the superior choice. Its solid-state design detects subtle, instantaneous wind shifts that a mechanical sensor could miss.
For large-scale strategic applications, such as resource assessment for a new wind farm or air quality modeling over an industrial zone, Doppler LIDAR is the appropriate technology. It provides a complete vertical profile of wind conditions, offering insights that are impossible to obtain from ground-level measurements alone.
How Often Should Wind Sensors Be Calibrated?
Regular calibration is non-negotiable for maintaining data integrity. Mechanical instruments like cup anemometers require annual calibration, as bearing wear can degrade accuracy over time.
Solid-state sensors, such as ultrasonic anemometers, are lower maintenance but still require periodic inspection. A professional check every 24 months, or as specified by the manufacturer, is recommended to ensure the data guiding your operational decisions remains reliable.
Disclaimer: ClimateRiskNow provides educational content to support business leaders in their risk management efforts. We do not sell insurance or financial products, and the information provided should not be interpreted as financial advice.
Neglecting sensor maintenance can lead to flawed data, resulting in poor decision-making and increased operational risk. It is a minor investment to ensure the integrity of the information protecting your assets.
At ClimateRiskNow, we translate complex weather data into clear, actionable intelligence for Texas-based industries. Our Sentinel Shield assessments identify your facility's specific vulnerabilities to extreme weather, empowering you to develop robust operational continuity plans and mitigate risks before an event occurs.