
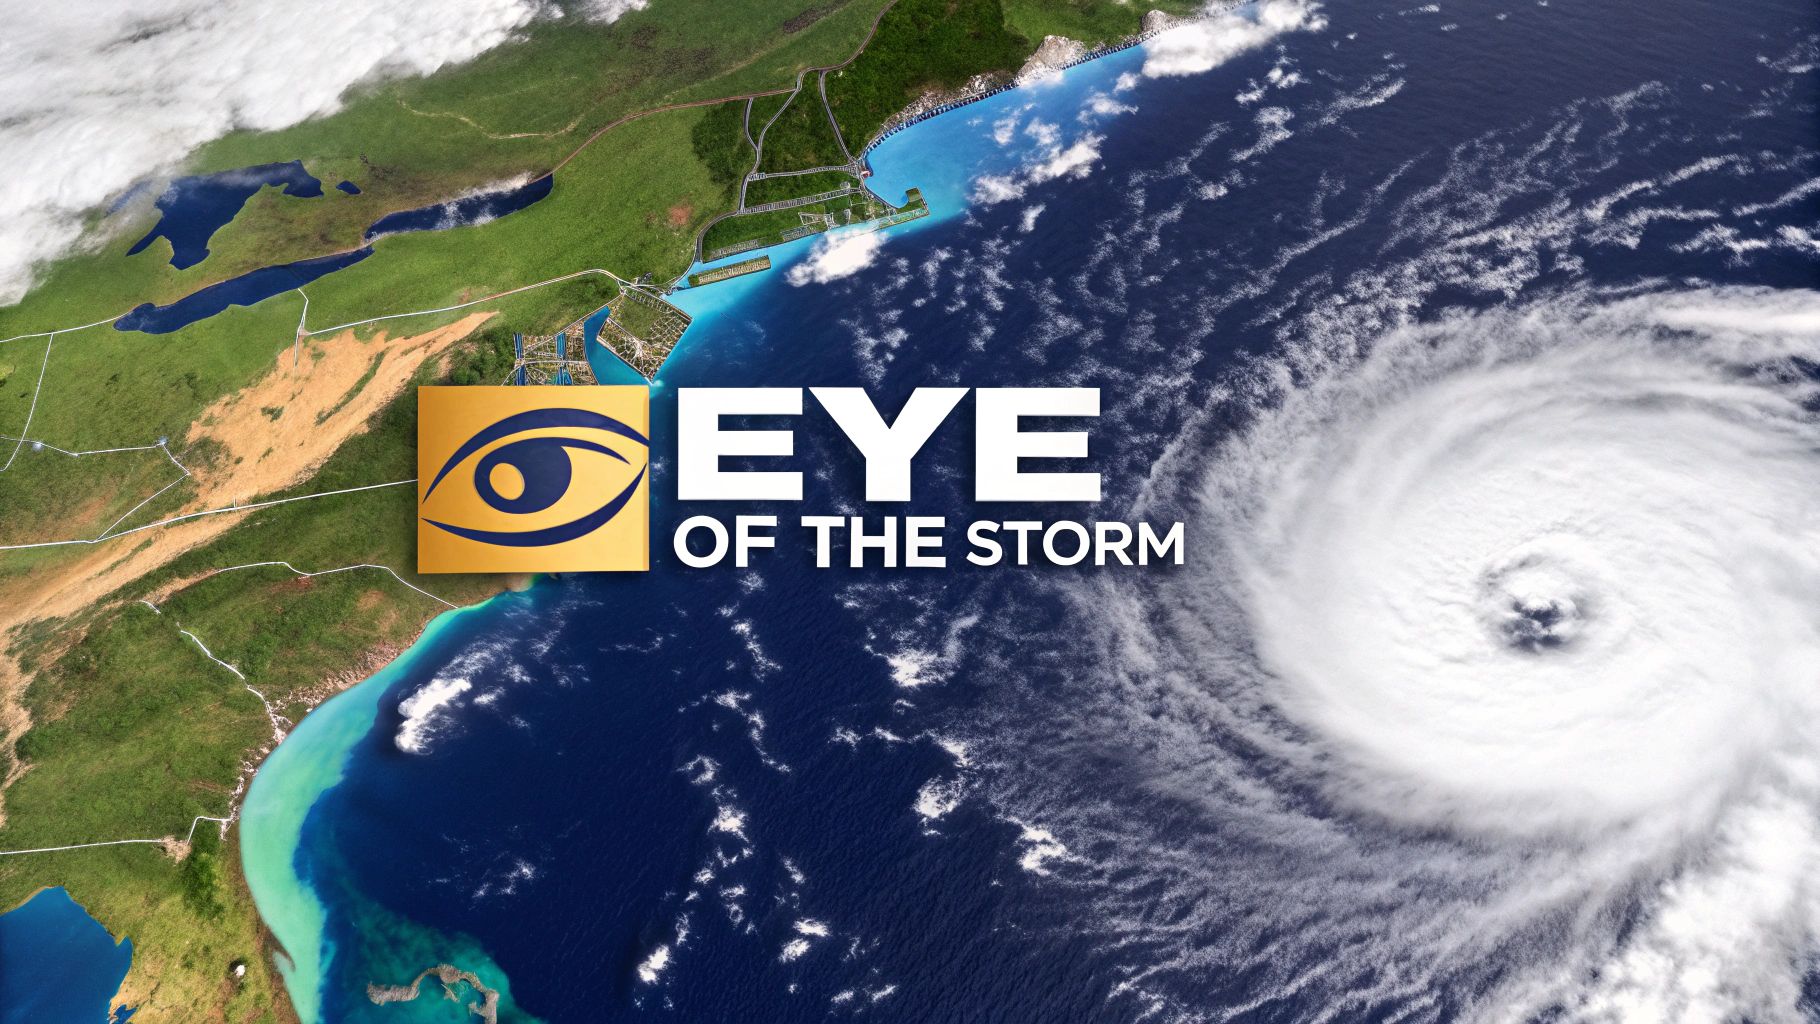
For Texas business leaders, understanding what a hurricane looks like on satellite imagery is a critical component of operational risk management. You are observing a massive, rotating system of clouds and thunderstorms spanning hundreds of miles, often with a distinct, calm eye at its center. This visual structure translates directly into specific, predictable threats that can impact facilities, supply chains, and personnel across key Texas industries.
Visualizing Hurricane Risks for Your Texas Operations
When viewed from a satellite, a hurricane's anatomy tells a story of potential disruption. Each component of the storm, from the outermost rainbands to the destructive core, signals a different type of risk for the Energy, Manufacturing, Logistics, Agriculture, and Construction sectors. Recognizing these features allows decision-makers to convert a weather forecast into actionable business intelligence.
For any enterprise in a hurricane-prone region like the Texas Gulf Coast, interpreting these visual cues is essential. A tightly organized storm with a well-defined eye poses a far more severe threat to a coastal petrochemical plant or a construction site than a disorganized system with no clear center. Differentiating between them is the first step in making informed operational decisions. You can see examples of what this looks like in these Hurricane Visuals for Texas Operations.
From Clouds to Catastrophe: Assessing Operational Threats
The storm's structure provides tangible insights for risk assessment:
- The Eye: The calm center is deceptive. Its arrival signifies the storm's midpoint, not its conclusion, often creating a false sense of security. This is a critical detail for any workforce safety protocol, as the storm's second half is imminent.
- The Eyewall: This ring of intense thunderstorms circling the eye contains the storm's most powerful winds and heaviest rainfall. It poses a direct physical threat to infrastructure, from manufacturing plants and port facilities to active construction sites.
- The Rainbands: These spiraling arms stretch for hundreds of miles, bringing significant flooding and the risk of tornadoes long before the storm's core makes landfall. For logistics and agriculture, these bands represent the first wave of operational disruption.
Visualizing these distinct components is the first step in building an effective risk mitigation strategy. For a deeper look into protecting your assets, refer to our complete guide on hurricane preparedness for businesses.
Disclaimer: ClimateRiskNow provides this information for educational purposes only and does not sell insurance or financial products. Any decisions made based on this content are the sole responsibility of the reader.
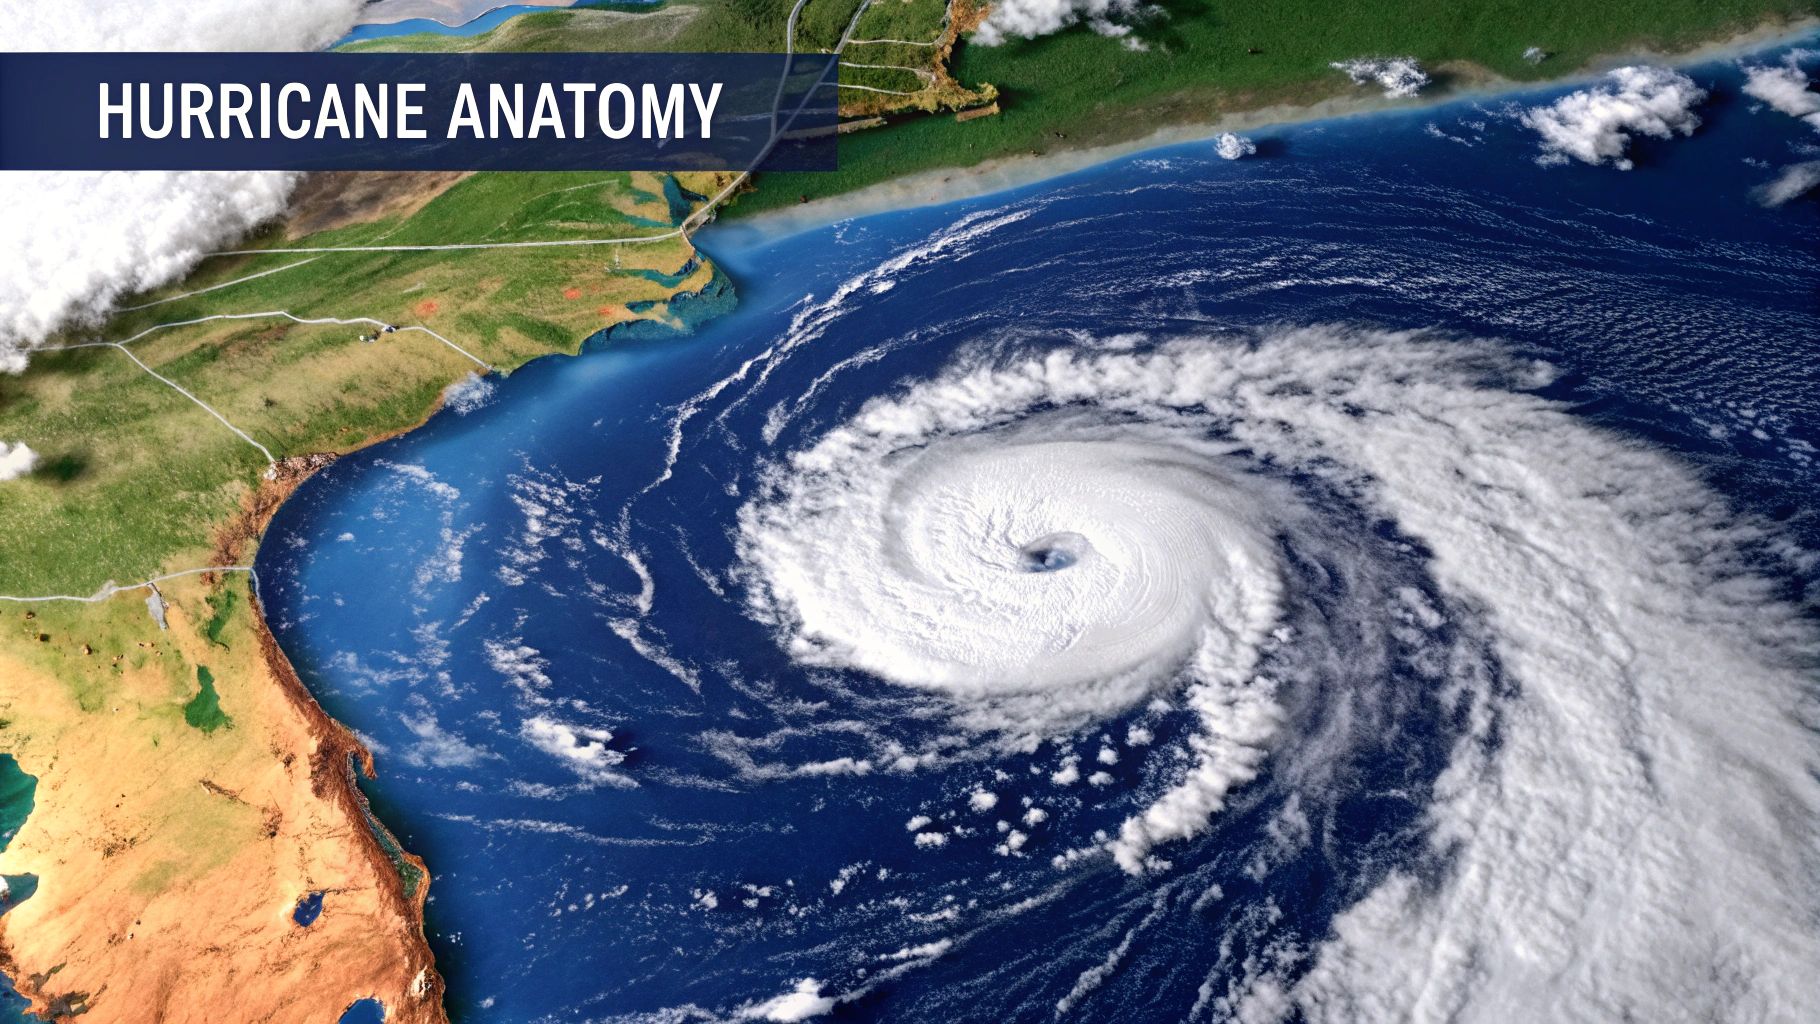
A Hurricane's Anatomy From a Satellite's Perspective
From space, a hurricane is a massive, spinning vortex of clouds fueled by warm ocean waters. For business leaders, knowing what a hurricane looks like is the first step in visualizing real-world operational risk. The entire system can be broken down into three distinct parts, each carrying its own threat profile. Understanding this structure is how you begin to translate a satellite image into a direct measure of its power and potential impact on your facilities.

This aerial view illustrates how a weather pattern organizes into a highly destructive force, one that directly threatens Texas industries annually. A 2017 analysis by the Texas Division of Emergency Management estimated Hurricane Harvey caused approximately $125 billion in damages, highlighting the immense financial stakes for businesses in the region.
The Three Core Visual Components
When observing a mature hurricane on a satellite feed, you are looking at three key parts:
- The Eye: The iconic, often cloud-free center of the storm. Caused by descending air, this area brings a deceptive period of calm. Misinterpreting this lull is a critical error in workforce safety protocols.
- The Eyewall: A violent, dense ring of thunderstorms surrounding the eye. This is where the storm's strongest winds and heaviest rain are concentrated, posing a direct physical threat to infrastructure, from petrochemical plants to active construction sites.
- Rainbands: Long, spiraling arms of clouds and thunderstorms that can stretch for hundreds of miles. They often arrive hours, or even days, before the storm's core, bringing early risks of flooding and tornadoes that can cripple logistics and agricultural operations.
A well-defined, symmetrical structure is often the sign of a more powerful and dangerous storm system. Recognizing this visual cue is essential for translating weather data into actionable business intelligence that calls for immediate and decisive preparation.
This breakdown helps decision-makers anticipate the sequence of impacts—what will arrive first, and what will be most destructive. For a deeper dive into turning storm data into asset-specific risk profiles, see our NOAA data analysis for Texas facilities.
Hurricane Components and Their Operational Risks
The table below breaks down what each part of the storm looks like and what it means for operations in Texas.
| Hurricane Component | Visual Characteristics | Primary Operational Risk |
|---|---|---|
| The Eye | A clear, calm, circular area at the storm's center. | False sense of security for on-site personnel, potentially leading to premature "all-clear" declarations and exposure when the back half of the eyewall hits. |
| The Eyewall | A dense, thick ring of clouds immediately surrounding the eye. Appears brightest on satellite imagery. | Catastrophic wind damage to structures, process equipment failure, and intense localized flooding that can breach containment systems. This is the single most destructive component. |
| Rainbands | Long, spiraling bands of clouds and thunderstorms extending outward from the center. | Early-onset flooding that disrupts supply chain logistics (road/rail closures) and site access. Potential for isolated tornadoes that can cause unexpected, localized damage. |
Analyzing a hurricane in these distinct parts—eye, eyewall, and rainbands—is the first step toward creating a practical, phased emergency response plan that protects both people and assets.
The Hurricane Eye: Deceptive Calm and Hidden Dangers
The eye of a hurricane is its most recognized feature, but for those managing on-the-ground operations, its arrival is one of the most dangerous moments of the event. This is not the end of the storm; it is a temporary, eerie lull. Sinking air at the storm's center creates a pocket of light winds and sometimes even clear skies. Mistaking this deceptive calm for safety is a critical, and potentially fatal, operational error.
This calm interval marks the halfway point. Dispatching teams to assess damage or restart operations prematurely exposes them to the full, renewed force of the trailing eyewall, which will strike with intense winds from the opposite direction.
Reading the Eye for Intensity Cues
A hurricane's visual structure on a satellite image provides vital intelligence for risk planners. The eye’s size and clarity are direct indicators of its power. A small, tight, well-defined eye almost always signals a mature and dangerous hurricane. In contrast, a ragged or cloud-filled eye often indicates a less organized, though still threatening, storm.
The diameter can vary significantly, from just 2.3 miles in a powerhouse storm like Hurricane Wilma to 230 miles in Typhoon Carmen. This size directly impacts how long the calm period lasts over a specific facility—it could be minutes or hours. Rapidly intensifying storms are known for forming extremely small, well-defined "pinhole" eyes," which signal extreme volatility.
A 'pinhole' eye—a very small, sharp, and clear center on satellite imagery—is a major red flag for operational planners. It indicates a storm that is rapidly intensifying, signaling extreme wind speeds and volatility that demand immediate final preparations and evacuation decisions.
Understanding these visual tells is a core part of practical risk assessment. Knowing what you are seeing on satellite feeds allows you to better contextualize official forecasts and align them with site-specific safety protocols. The conditions required for hurricanes to form are what enable these powerful structures to develop.
The Eyewall: A Hurricane's Engine of Destruction
If the eye is the quiet center, the eyewall is the storm’s engine. This towering ring of thunderstorms that circles the eye is where a hurricane unleashes its most ferocious power. The system's strongest winds and heaviest rainfall are concentrated here, making it the component responsible for the catastrophic damage that can cripple industrial operations.
For any Texas facility, the eyewall is the primary physical threat. Its arrival can shred roofing, compromise building integrity, and turn unsecured materials at a construction site into deadly projectiles. Texas energy infrastructure—from transmission lines to coastal processing plants—is exceptionally vulnerable to the eyewall's focused force.
Decoding the Eyewall Replacement Cycle
On satellite or radar imagery of a powerful hurricane, you might observe an eyewall replacement cycle. For business leaders, this is a critical visual cue signaling a major shift in the storm's intensity and size. A new, outer eyewall begins to form, slowly cutting off the original, inner eyewall from its energy source.
This process has direct implications for on-the-ground operations:
- Temporary Intensity Drop: As the cycle begins, the storm's maximum sustained winds often decrease temporarily. This can be deceptive.
- Expanding Wind Field: Simultaneously, the storm's overall destructive wind field grows much larger, spreading damaging winds over a far wider area.
- Re-intensification: Once the replacement is complete, the hurricane often re-intensifies, sometimes becoming even stronger just as it is nearing the coast.
Understanding this cycle is vital for high-stakes decisions. A storm that appears to be weakening could actually be expanding its threat footprint and gathering strength for a final, more powerful impact—crucial intelligence when finalizing evacuations and securing assets.
This visual process is why continuous monitoring is non-negotiable. The storm's intensity 12 hours before landfall may not be what your facility ultimately faces. To truly assess this threat, it is important to understand the mechanics behind these powerful winds, a topic we cover in our guide on how wind is measured.
Rainbands: The First Sign of Widespread Disruption
Long before a hurricane's destructive core makes landfall, its presence is announced by the arrival of its outer rainbands. These long, spiraling arms of thunderstorms can stretch for hundreds of miles, often reaching the coast hours, or even a full day, ahead of the eye. For Texas businesses in Logistics, Agriculture, and Construction, these bands are not just a warning—they are the leading edge of operational disruption.
These bands carry their own distinct risks that can catch unprepared facilities off guard. They are frequently loaded with strong wind gusts that can damage unsecured equipment and can spawn quick, embedded tornadoes that pose a sudden, severe threat. Monitoring the arrival and intensity of these rainbands is a critical first step in risk assessment.
Operational Impacts of Outer Bands
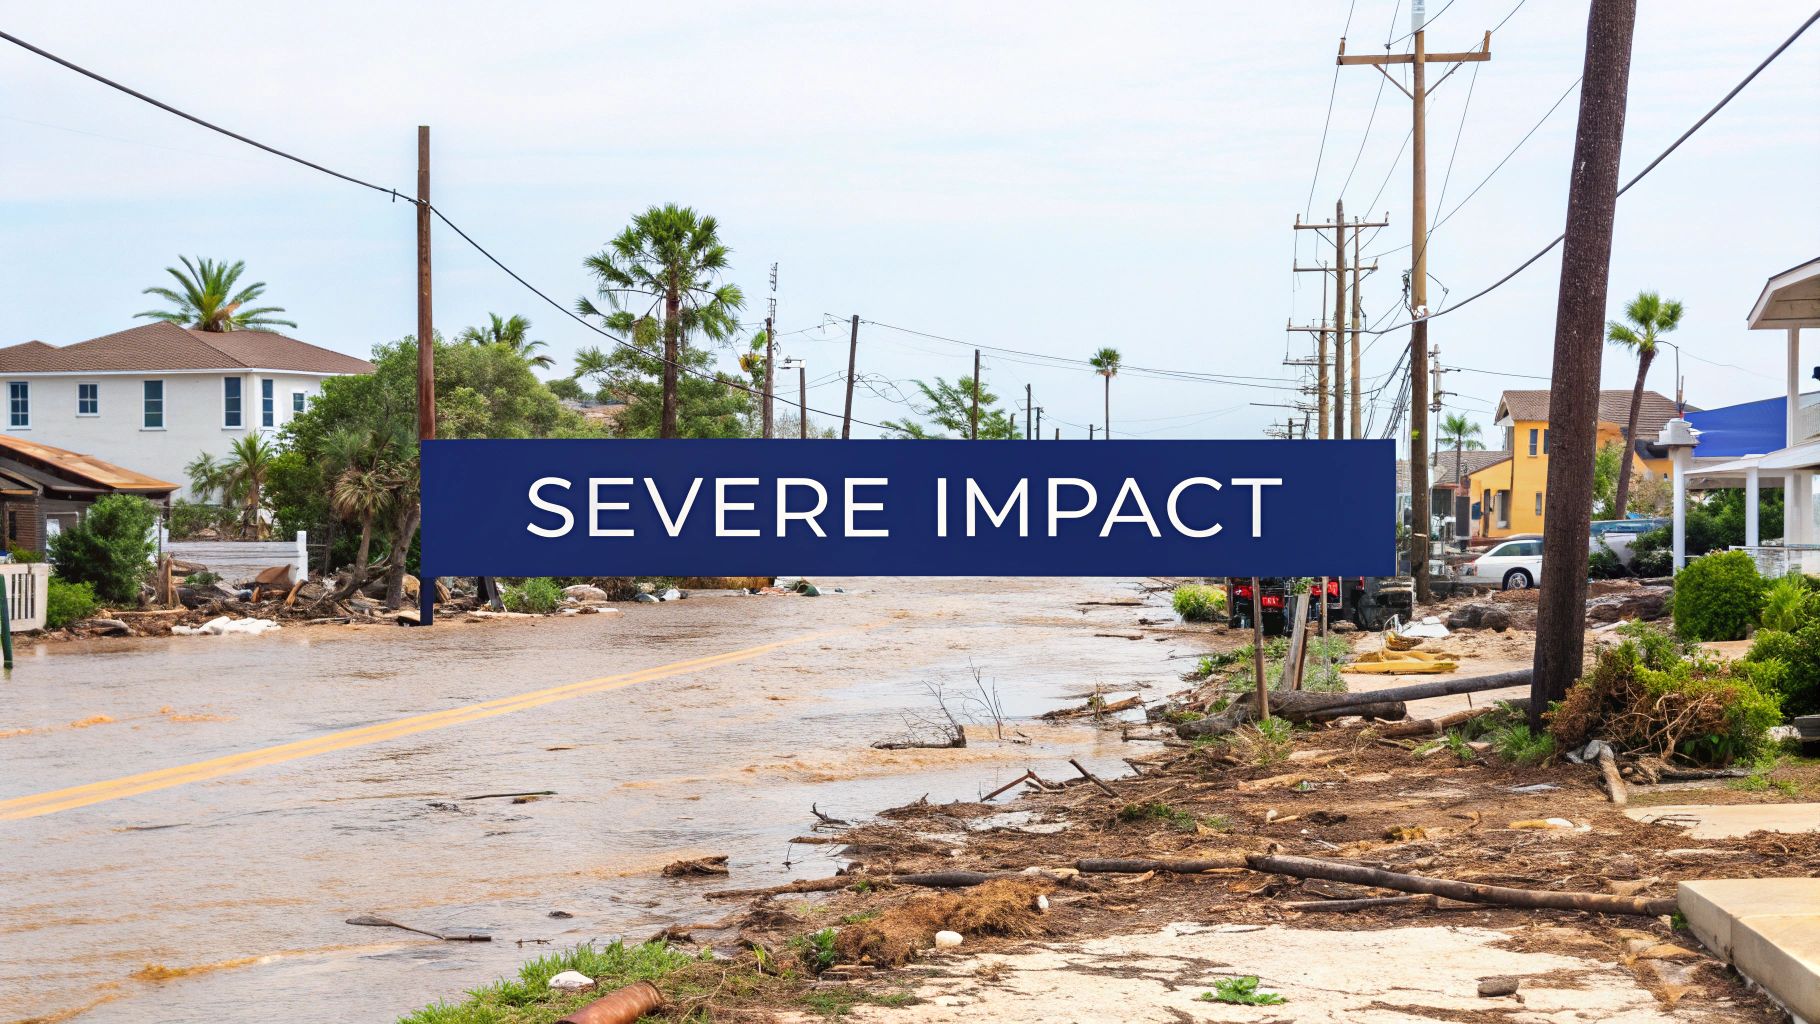
The most immediate threat from rainbands is often intense, localized downpours that overwhelm drainage systems. This leads to flash flooding that can paralyze critical business functions well before the storm's worst conditions arrive.
- Supply Chain Paralysis: Flooded roadways and rail lines, such as those along the critical I-10 corridor, can halt the movement of goods, creating costly delays for manufacturing and logistics.
- Site Inaccessibility: Key personnel may be unable to reach facilities to perform final shutdown procedures or secure assets, leaving sites exposed.
- Agricultural Losses: Fields can become saturated, ruining crops like cotton and grain sorghum and making it impossible to move heavy farming equipment to safety.
For logistics and construction firms, the moment the first rainbands appear on radar is the final call to action. It signals a rapidly closing window to move vehicle fleets to high ground, secure construction sites, and ensure all personnel are safely off-site.
Understanding how quickly these outer bands can escalate into a serious flood event is essential. To better handle this specific threat, it is worth reviewing these key facts about flooding.
How to Read Storm Imagery as Business Intelligence
For any business leader in Texas, learning to read a hurricane on a satellite or radar map is a critical source of business intelligence. Publicly available imagery from sources like NOAA transforms abstract weather reports into a visual risk assessment tool, providing a real-time view of a storm's potential threat to specific assets.
Spotting key visual cues is paramount. A powerful, mature hurricane often has a clear, symmetrical structure with a well-defined eye—a sign of a stable and intense system. Conversely, a disorganized storm may look ragged and lopsided, which can signal more erratic behavior—a different kind of threat that still requires careful risk management.
From Visual Cues to Strategic Decisions
This visual data provides actionable insights for proactive risk management. For instance, statistical studies have found that the average hurricane maintains a visible eye for about 30 hours, offering a crucial window to track its intensity. This climatological data helps forecasters sharpen their predictions and gives businesses a better handle on a storm's evolution. You can read more about this in NOAA's research on the global climatology of tropical cyclone eyes.
When you view hurricane imagery through an operational lens, you can better anticipate the timing and severity of its impact. This allows you to make smarter, more strategic decisions about protecting assets, shoring up supply chains, and ensuring workforce safety long before the storm makes landfall.
Disclaimer: ClimateRiskNow provides this information for educational purposes only. We do not offer financial advice or sell insurance products, and any decisions made based on this content are the sole responsibility of the reader.
Hurricane Visuals: Answering Key Questions for Texas Businesses
Interpreting hurricane satellite imagery can be complex. Here are answers to common questions Texas business leaders ask to translate these visuals into operational risk assessments.
Does a Bigger Eye Mean a Stronger Hurricane?
No, not necessarily. While a clear, well-defined eye is a sign of a powerful, organized storm, its size is not a reliable measure of wind speed. In fact, some of the most ferocious hurricanes have had very small "pinhole" eyes. A better indicator for operational risk is the eye's symmetry and the integrity of the surrounding eyewall. A round, stable eye surrounded by a solid eyewall indicates a mature and dangerous system.
How Far From the Eye Will Operations Be Impacted?
Impacts extend much farther than many assume. Significant, disruptive weather can stretch for hundreds of miles from the storm's center. The outer rainbands often arrive 12 to 24 hours ahead of the eye, bringing tornadoes and flash floods that can shut down logistics long before the core of the storm hits. A typical hurricane can have tropical-storm-force winds spanning a diameter of over 300 miles, meaning construction sites and other outdoor operations must be secured well before the storm's center is near.
Is It Safe to Go Outside When the Eye Passes Over?
Absolutely not. The calm inside the eye is deceptive and poses an extreme danger if misinterpreted. It is merely a temporary lull—the storm's halfway point.
For workforce safety, it is critical to understand that the calm eye will be followed by the storm's trailing eyewall, which brings hurricane-force winds from the opposite direction. Resuming operations prematurely is extremely dangerous; all personnel must remain in a secure location until authorities give the official all-clear.
ClimateRiskNow provides location-specific risk intelligence to help Texas businesses translate complex weather data into strategic, proactive decisions. Gain a clear view of your operational exposure by requesting a demo of our Sentinel Shield platform.