

For Texas industries like Energy & Petrochemical, Manufacturing, Logistics, Agriculture, and Construction, the old playbook for managing risk is no longer sufficient. Relying on historical events to forecast future disruptions from extreme weather or supply chain shocks is an outdated approach. Business leaders need a more forward-thinking way to protect their operations and assets.
This is where data analytics for insurance and operational risk planning steps in, offering a significant advantage. It represents a complete change in mindset—moving away from reactive cleanup after a disaster to proactively building an organization that can withstand future shocks.
Think of it as the difference between a generic weather forecast and a custom climate model built specifically for your facility's location and operational vulnerabilities.
Moving Beyond Traditional Risk Management
Instead of just reacting, data analytics helps you get ahead of the curve. It's about using advanced analysis to anticipate operational disruptions, identify specific vulnerabilities, and make smarter, more informed decisions about how you manage risk. This approach ditches generalized historical averages and instead builds a high-resolution, predictive model tailored to your unique Texas operations.
This infographic shows just how fast this approach is being adopted, driven by massive data growth and a clear return on investment in operational efficiency.
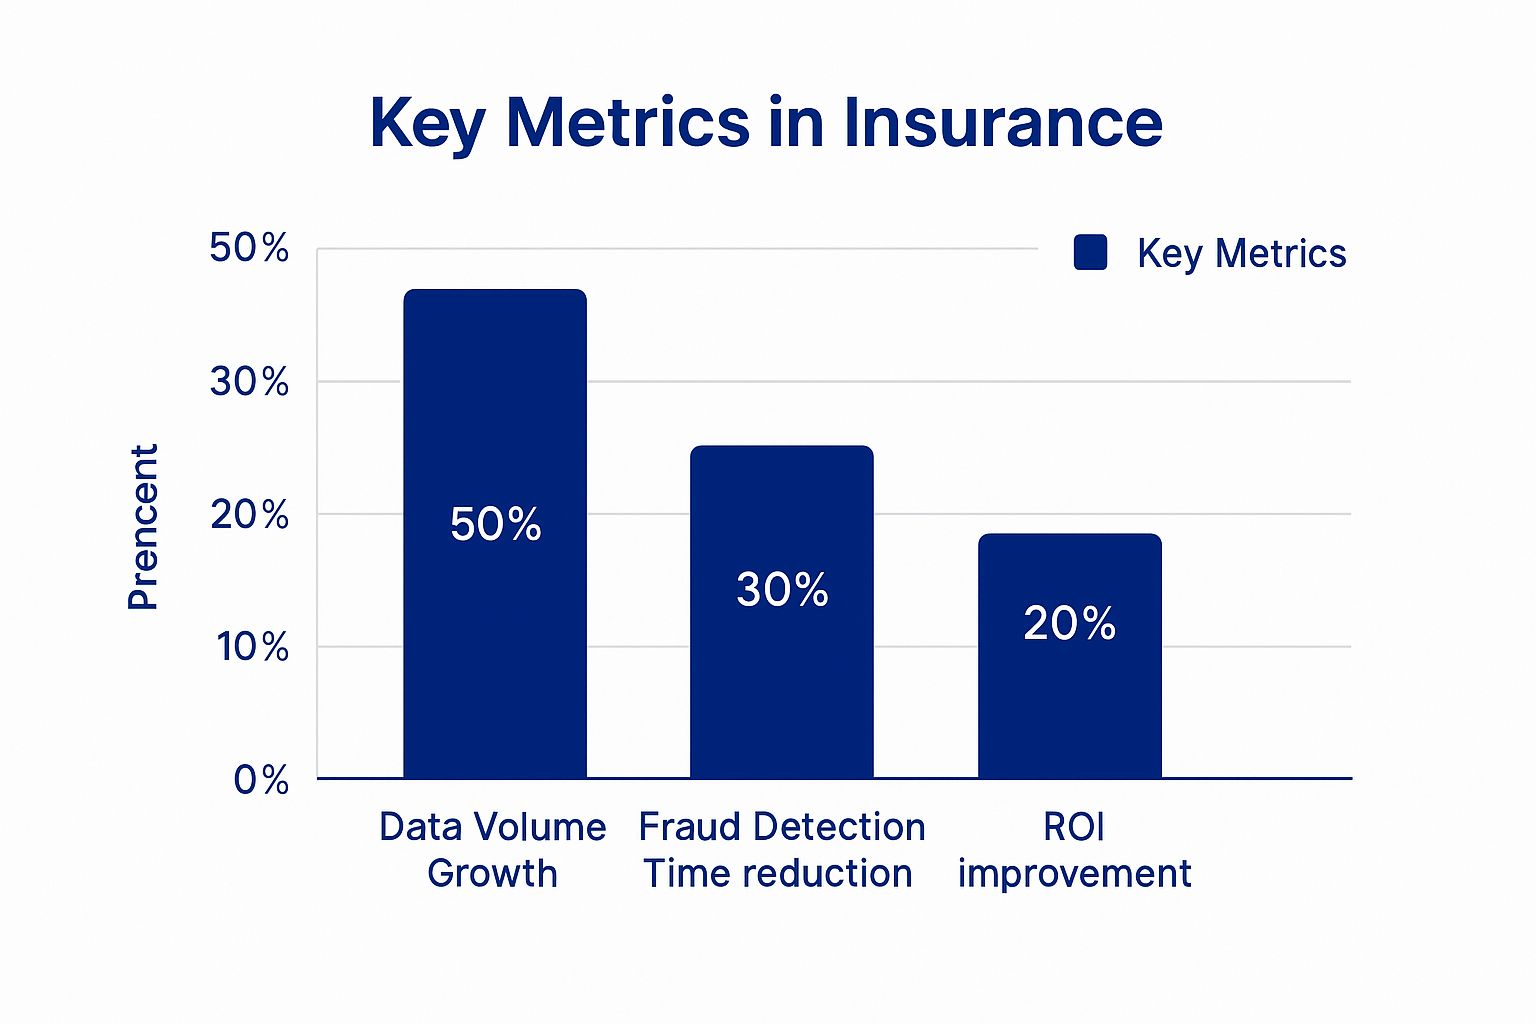
The numbers are clear: as the amount of available data explodes, so do the efficiency and financial benefits of putting sophisticated analytics to work for risk management.
A New Framework for Assessing Threats
Forget about broad, industry-wide risk assessments. Data analytics gives you a granular, location-specific view of your vulnerabilities.
For a petrochemical plant on the Gulf Coast, this means analyzing hyperlocal storm surge models and their potential impact on critical equipment. For a logistics hub in North Texas, it could involve predicting how a severe ice storm will snarl transportation routes and affect fleet availability, a lesson learned from events like Winter Storm Uri in 2021.
This data-driven method empowers executives to:
- Anticipate Disruptions: Identify potential weak points in your operations before an extreme weather event puts them to the test.
- Pinpoint Vulnerabilities: Understand exactly which assets, processes, or supply chain links are most exposed to events like hurricanes, floods, or extreme heat.
- Strengthen Preparedness: Develop targeted mitigation plans based on quantitative analysis, not just educated guesses.
This transition from traditional methods to a data-first mindset is a significant operational shift, reflected in the market's rapid growth.
Shift from Traditional to Data-Driven Risk Assessment
The table below contrasts the old, reactive methods with the new, proactive approach for key Texas industries. It highlights how data changes the entire equation, from identifying risks to making critical operational decisions.
| Aspect | Traditional Approach (Reactive) | Data-Driven Approach (Proactive) |
|---|---|---|
| Data Source | Historical loss data, industry averages | Real-time sensor data, climate models, supply chain feeds |
| Risk Identification | Based on past incidents and known hazards | Predictive modeling to identify emerging threats |
| Vulnerability Analysis | General assessment of facility type | Granular analysis of specific equipment and process weak points |
| Decision Making | Based on experience and qualitative judgment | Based on quantitative analysis and probability scenarios |
| Mitigation Strategy | Generalized emergency response plans | Targeted, pre-emptive actions and resource allocation |
This evolution is about making smarter, evidence-based decisions that directly protect your bottom line and ensure operational continuity.
The market reflects this growing importance. The global insurance analytics market was valued at around USD 15.33 billion and is projected to hit USD 51.45 billion by 2033, growing at a rate of 14.4% each year. You can discover more insights about insurance analytics market trends from Straits Research.
Disclaimer: ClimateRiskNow does not sell insurance or financial products. The information provided is for educational purposes only and should not be interpreted as financial advice or an insurance recommendation. Our goal is to equip Texas business leaders with data-driven insights for operational risk management.
By embracing data analytics, companies can switch from a defensive stance to an offensive one, actively managing risks instead of just waiting to react to them. For more on this, check out our guide on effective business risk management strategies.
How Granular Data Transforms Risk Understanding
For decades, risk assessment has painted with a broad brush. A company's risk profile was often determined using general industry data, lumping similar businesses together regardless of their individual safety measures or operational resilience.
Data analytics changes the game entirely. Think of it as the difference between a blurry, hand-drawn map and a high-resolution, real-time satellite image. That’s the leap in precision we're talking about.
For Texas business leaders, this means risk profiles can finally reflect your specific operational realities, not just the category your business falls into. This detailed insight opens the door to more effective risk management and mitigation strategies.

From Industry Averages to Individual Risk Profiles
In the past, a manufacturing plant in Houston and another in Dallas might get similar risk ratings just because they operate in the same sector. But data analytics for insurance and risk management digs much deeper, getting into the unique operational DNA of each business.
The process involves pulling and analyzing granular data from a whole host of sources to build a comprehensive risk profile that is unique to your company. It’s no longer about what’s typical for your industry; it’s about what’s true for your business.
This high-resolution view comes from key data sources, including:
- IoT Sensor Data: Information from sensors on manufacturing equipment can flag maintenance needs before a breakdown, reducing the risk of failure during a critical period, like an extreme heatwave.
- Fleet Telematics: For logistics companies, telematics offers a clear picture of on-the-road risk by providing real-time data on driver behavior, vehicle health, and route efficiency. Our guide on telematics for insurance explains this in greater detail.
- Building Management Systems: Data from HVAC and structural monitoring systems can highlight a commercial building's vulnerabilities well before a winter storm or flood arrives.
By analyzing these specific data points, a business can demonstrate a lower risk profile based on its actual safety protocols and operational discipline—moving far beyond generalized assumptions.
The Impact on Risk Assessment and Mitigation
This shift to granular data creates a much more accurate and actionable system.
When decision-makers can see the specific measures a construction firm has taken to secure a worksite against high winds, they can make far more informed decisions. The same goes for an agricultural operation in West Texas using smart irrigation technology to manage drought risk.
This level of detail ensures that your proactive risk management efforts are recognized and factored into your overall strategy. It aligns your mitigation investments with the actual risks you face, not a generic industry benchmark.
This data-driven approach doesn’t just improve accuracy; it has a significant effect on productivity and insight. In fact, companies that effectively use data analytics have seen operational productivity improve significantly.
Ultimately, granular data empowers Texas business leaders to take control of their risk narrative. By providing a transparent, data-backed view of your operations, you can have more strategic conversations about risk mitigation and ensure your resilience efforts are accurately targeted.
Speeding Up Post-Event Recovery

When a hurricane hammers the Texas coast or a supply line snaps, every minute of downtime costs money. Getting your business back up and running depends heavily on how fast and accurately damage can be assessed.
This is where data analytics for insurance and recovery planning changes the game. We're moving way beyond manual inspections and piles of paperwork. By leveraging AI and automation, post-event assessments become faster, smarter, and far more reliable.
For an executive in a Texas-based industry, these tools mean a more resilient operation and a much quicker path back to business as usual. For a complete picture, see how data tools are evolving in our guide on analytics for insurers.
Faster, Sharper Damage Assessments
Picture a petrochemical plant on the Gulf Coast after a major storm rolls through. In the past, assessing the damage could take weeks. Teams would have to physically navigate the site, dealing with safety risks and delays.
Today, technology completely rewrites that timeline.
- Drone Imagery: High-resolution drones can map a large industrial site in hours, gathering incredibly detailed images of roofs, equipment, and infrastructure.
- AI-Powered Analysis: Smart algorithms sift through this visual data, instantly spotting structural damage to buildings, machinery, and other assets.
- Automated Reporting: The system can then generate a preliminary damage report, allowing recovery planning to begin almost immediately.
This data-first approach can shrink the initial evaluation from weeks down to just a few days. That means repairs and operational recovery can start that much sooner. A 2023 McKinsey report found that insurers using these methods cut their claim processing times by an average of 30%—a massive advantage for business continuity.
By automating routine tasks and using predictive models to assess damage severity, businesses can accelerate recovery, improve operational efficiency, and ensure accuracy. This is a crucial advantage when restoring complex industrial operations.
Proactively Improving System Integrity
Fraudulent claims have historically driven up costs for everyone. While not a direct operational task, understanding how data analytics combats this issue highlights the power of the technology.
Modern algorithms can analyze massive amounts of data in real-time, looking for red flags that signal anomalous activity. These systems are trained to spot suspicious patterns, like multiple claims from the same location in a short time or inconsistencies in documentation.
This proactive detection helps maintain the integrity of the insurance system. By flagging anomalies automatically, legitimate claims get the attention they need, making the process more efficient for honest businesses.
Disclaimer: This information is for educational purposes only. ClimateRiskNow does not sell insurance or financial products.
Putting Data Analytics to Work in Your Business
Making your business data-driven doesn't have to be a massive, complex overhaul. For Texas leaders in sectors like construction, agriculture, or manufacturing, it boils down to practical, focused steps. The goal is simple: turn your raw operational data into a clear strategic advantage against disruptions like extreme weather.
The first move is to pinpoint your most critical data. This isn’t about collecting everything—it’s about targeting the specific information that reveals your biggest vulnerabilities. For a manufacturing plant, that could be equipment performance metrics during heat waves. A logistics firm might focus on transportation choke points in its supply chain.
Once you know what data you need, its quality is non-negotiable. Inaccurate or incomplete information will only lead to flawed models and unreliable predictions, undermining the entire effort before it even begins.
Building Your Analytics Foundation
With clean, relevant data in hand, you can start using analytics tools to build predictive models. Think of these models as custom-built tools designed to answer specific operational questions. They can help you forecast equipment failure during a brutal Texas summer or anticipate shipping delays caused by a sudden flash flood.
A successful rollout almost always follows a clear, phased approach. It’s a journey that moves from basic data collection to sophisticated, predictive insights that can genuinely shape your decisions.
Disclaimer: ClimateRiskNow does not sell insurance or financial products. The information provided in this article is for educational purposes only and should not be considered financial advice or an insurance recommendation. Our mission is to help business leaders make informed decisions about operational risk.
For any of this to matter, you have to present the findings in a way decision-makers can understand. Learn how to turn complex data into compelling reports with effective data visualization. This step is crucial for ensuring everyone, from the plant floor to the executive suite, understands the insights.
Actionable Steps for Data Integration
The path from raw numbers to smart business moves involves several key phases. The table below lays out a practical framework for a Texas business, using a manufacturing plant as an example of how it works in the real world.
| Phase | Key Objective | Example for a Manufacturing Plant |
|---|---|---|
| 1. Data Identification | Pinpoint critical data streams for risk assessment. | Collect real-time temperature and vibration data from key machinery sensors. |
| 2. Data Quality Assurance | Ensure data is accurate, complete, and consistent. | Implement automated checks to flag anomalies or missing sensor readings. |
| 3. Model Development | Build predictive models for specific operational risks. | Create a model that correlates high ambient heat with equipment failure rates. |
| 4. Insight Generation | Translate model outputs into clear business actions. | Generate alerts for proactive maintenance before a predicted heatwave hits. |
The growth in this field speaks for itself. North America dominated the insurance analytics market with a 34.7% revenue share, a trend driven largely by businesses in the United States. The global market, valued at USD 13.84 billion, is expected to hit USD 31.33 billion by 2030. You can read the full research about the insurance analytics market on Grand View Research.
This explosive market growth highlights how much businesses are relying on data to manage risk. For Texas companies, starting now means building a more resilient and competitive operation. You can learn more about the specific technologies involved by exploring our overview of climate risk assessment tools.
Navigating Data Privacy and Implementation Hurdles
Diving into data analytics opens up incredible new ways to build operational resilience, but it also comes with its own set of challenges. For any Texas business leader, addressing these hurdles is a key part of the strategy. The main obstacles usually boil down to data privacy, cybersecurity threats, and the upfront cost of technology and specialized talent.
These are not dealbreakers, but known variables you can plan for. By understanding the landscape and committing to ethical data management from day one, you can tap into the full power of data analytics for insurance-related planning while protecting your business.
Addressing Regulatory and Security Concerns
In Texas, data privacy isn't just good practice—it's the law. When handling sensitive operational information, you must comply with state regulations like the Texas Data Privacy and Security Act (TDPSA), effective July 1, 2024. A big piece of this puzzle involves securing your data analytics platform with features like SOC2 and RLS to demonstrate that data is being handled responsibly.
Building a secure and compliant framework means taking a few critical actions:
- Understand Your Legal Obligations: Familiarize your team with the specific state and federal regulations that apply to the data you collect and process.
- Implement Strong Cybersecurity: Shield your data infrastructure from breaches. This means using encryption, tight access controls, and running regular security audits.
- Ensure Ethical Data Use: Create clear internal policies that spell out exactly how data can be used for risk assessment, ensuring everything is transparent and accountable.
Disclaimer: ClimateRiskNow does not sell insurance or financial products. The information provided is for educational purposes only and should not be considered financial advice or an insurance recommendation. To learn more about our commitment to data protection, please review our privacy policy.
Overcoming Implementation and Talent Gaps
Beyond regulations, the practical side of implementation has its own challenges. Integrating a new analytics platform with legacy systems can be complex and requires careful planning to avoid disrupting daily operations.
Then there's the talent issue. Finding people skilled in both data science and your specific industry—whether it's logistics, manufacturing, or energy—can be difficult.
A phased approach is often the best way forward. Start small with a focused pilot project in one high-impact area, like predicting equipment failure in a critical facility. This lets your team build expertise, demonstrate a clear return on investment, and gradually scale your analytics capabilities across the company without overstretching resources.
The Future of Risk Management is Data-Driven
The old ways of managing operational risk for Texas businesses are becoming obsolete. Data analytics for insurance and resilience planning isn't just a new tool; it's a fundamental shift in how companies prepare for the future. This evolution is accelerating, moving beyond today’s capabilities toward predictive frameworks that will define the next chapter of risk management.
Advanced AI and machine learning models are getting sharper by the day. Soon, they won’t just predict potential disruptions with better accuracy—they’ll recommend specific, pre-emptive actions to mitigate them. Imagine a logistics company getting an alert to reroute shipments days before a storm even forms, based on high-probability forecasts. That is the future of operational resilience.
Integrating ESG for Deeper Resilience
One of the biggest changes is the growing weight of Environmental, Social, and Governance (ESG) data. Investors, partners, and customers now see strong ESG metrics as a clear indicator of a company's long-term stability and resilience. Data analytics makes it possible to turn abstract sustainability goals into hard, measurable numbers.
For example, tracking water usage at a large agricultural operation or emissions from a manufacturing plant provides tangible proof of your commitment to sustainable practices. It’s no longer just a statement; it's data that strengthens your company’s reputation and provides a competitive edge.
This blend of operational and ESG data paints a complete picture of corporate resilience. It shows you're not only ready for immediate physical threats but are also building a sustainable, future-proof business that the market demands.
Ultimately, using data analytics is no longer a choice—it's a core business strategy. It delivers the clarity you need to build a more competitive, resilient, and forward-looking company that is truly prepared for tomorrow's uncertainties.
Disclaimer: ClimateRiskNow does not sell insurance or financial products. All information provided in this article is for educational purposes only and should not be interpreted as financial advice or an insurance recommendation.
Have Questions? We Have Answers.
A few common questions we hear about putting data analytics to work for operational risk management.
How Can Data Analytics Help Us Prepare for Extreme Weather in Texas?
Think of it as moving from looking in the rearview mirror to looking at a detailed road map of what’s ahead. Instead of just relying on past weather patterns, data analytics lets us build predictive models. We can dig into hyperlocal climate data, pinpoint specific infrastructure vulnerabilities, and map out your supply chain dependencies.
This means you can see where the operational risks are before a hurricane makes landfall or a heatwave settles in. That insight allows you to put targeted, effective strategies in place to protect your most critical assets.
What Kind of Data Is Most Valuable for Risk Assessment?
The real power comes from combining different types of information. The most valuable data streams often include real-time information from IoT sensors on your machinery, telematics from vehicle fleets, logistics data from your supply chain, and highly localized environmental data.
When you merge this internal operational data with external sources, you get a complete and, more importantly, actionable view of your potential risks. It’s the difference between a blurry snapshot and a high-definition picture.
Disclaimer: ClimateRiskNow does not sell insurance or financial products. The information provided is for educational purposes only and should not be interpreted as financial advice or an insurance recommendation. Our goal is to equip Texas business leaders with data-driven insights for operational risk management.
Is This Kind of Data Analytics Too Expensive for My Business?
That’s a fair question. While there's an initial investment, the cost of data analytics has dropped significantly thanks to more accessible cloud-based platforms. You don't need a massive, in-house server farm anymore.
The return on that investment often shows up in reduced downtime, smarter maintenance schedules, and being genuinely prepared for disruptions—all of which can prevent financial losses that would dwarf the initial cost. A smart way to start is by focusing on one critical operational area, proving the value, and then expanding from there.
Gain the clarity you need to protect your Texas operations from extreme weather. ClimateRiskNow delivers location-specific risk intelligence to help you build a more resilient business.