

Analytics for insurers is the practice of using data, statistical analysis, and predictive modeling to gain a clearer understanding of operational risks and opportunities. It is how insurance carriers and the businesses they serve make smarter, data-driven decisions. This modern approach goes far beyond traditional actuarial science by integrating vast, real-time datasets to proactively manage risk, enhance operational efficiency, and build resilience against emerging threats.
The New Blueprint for Insurance Analytics

The insurance industry is transitioning from static, historical models to a dynamic, forward-looking methodology. Traditional methods were akin to navigating with a paper map—adequate for established routes but insufficient for unforeseen disruptions like extreme weather events or supply chain failures.
Modern analytics functions as a live GPS, providing real-time data on everything from incoming weather patterns to logistical bottlenecks.
This is not a minor adjustment; it is a fundamental overhaul of how risk is assessed and managed. By analyzing diverse data from telematics, IoT sensors, satellite imagery, and operational reports, organizations gain a much sharper understanding of their specific risk landscape. This leads directly to more precise underwriting, streamlined claims processing, and the ability to anticipate operational challenges before they escalate.
The financial commitment to this approach is significant. The global insurance analytics market is projected to more than double, growing from $14.71 billion in 2024 to $32.92 billion by 2029, at a compound annual growth rate of 18.4%. The industry is clearly investing heavily in data to navigate today's complex risk environment. Discover more insights about insurance analytics market growth.
Why Analytics Is a Core Operational Necessity
For business leaders in Texas—where industries like energy, manufacturing, and logistics face constant threats from extreme weather—this data-first approach is non-negotiable. Instead of reacting after a storm, analytics enables proactive preparation. For example, a logistics company in Houston can use analytics to model a hurricane's potential impact on delivery routes and warehouses, allowing for preemptive adjustments to protect assets and maintain operational continuity.
Analytics transforms risk management from a reactive safety net into a proactive strategic function. It empowers decision-makers to make data-informed choices that protect assets and ensure business resilience.
The benefits of a robust analytics strategy directly impact the bottom line. In a volatile environment, modern analytics provides the tools necessary to remain competitive and resilient.
Comparing Traditional vs Analytics-Driven Insurance
The shift from historical methods to a data-powered approach is stark. It represents the difference between a static filing cabinet and a real-time operational dashboard. The following table illustrates how key operational areas have evolved.
| Operational Area | Traditional Approach | Analytics-Driven Approach |
|---|---|---|
| Risk Assessment | Based on historical data and generalized risk pools. | Granular, asset-specific analysis using real-time data. |
| Underwriting | Manual, checklist-driven process. | Automated with AI models for faster, more accurate pricing. |
| Claims Processing | Manual review, often slow and prone to error. | Automated fraud detection and streamlined processing. |
| Customer Interaction | One-size-fits-all communication. | Personalized offers and proactive risk alerts. |
| Product Development | Based on broad market trends and intuition. | Data-driven insights into specific customer needs and behaviors. |
This table highlights a fundamental evolution. Analytics is not merely a new tool; it is a new operational philosophy that places data at the heart of every major decision, from pricing a policy to processing a claim.
Here’s a closer look at how analytics elevates key insurance functions:
- Smarter Risk Assessment: Instead of grouping assets into broad categories, risks can be evaluated at a granular level, factoring in real-time weather threats and specific infrastructure vulnerabilities.
- Enhanced Operational Efficiency: Automating routine underwriting and claims tasks frees up expert personnel to focus on complex, high-value decisions requiring human judgment.
- Personalized Customer Engagement: Data provides a deep understanding of customer needs and behaviors, enabling the creation of relevant products and communications.
This evolution is a critical component of the broader digital transformation occurring across the industry. As carriers adopt new technologies, analytics serves as the engine driving more intelligent and effective operations. To understand the broader context, you can learn more about digitalisation in the insurance industry in our article.
Ultimately, analytics for insurers is about one objective: turning raw data into a tangible strategic advantage.
Disclaimer: ClimateRiskNow does not sell insurance or financial products. The information provided in this article is for educational and informational purposes only and should not be interpreted as financial advice or an insurance recommendation. We encourage business decision-makers to consult with qualified professionals for guidance specific to their operational needs.
Understanding the Four Pillars of Insurance Analytics
To build a truly data-driven operation, it is crucial to understand the different types of analytics and how they function together as a cohesive framework. This can be viewed as a journey, with each level of analysis answering a progressively more complex question, moving from a review of past events to actively shaping future outcomes.
This framework, often referred to as the four pillars of insurance analytics, provides a clear pathway for converting raw data into decisive, strategic action.
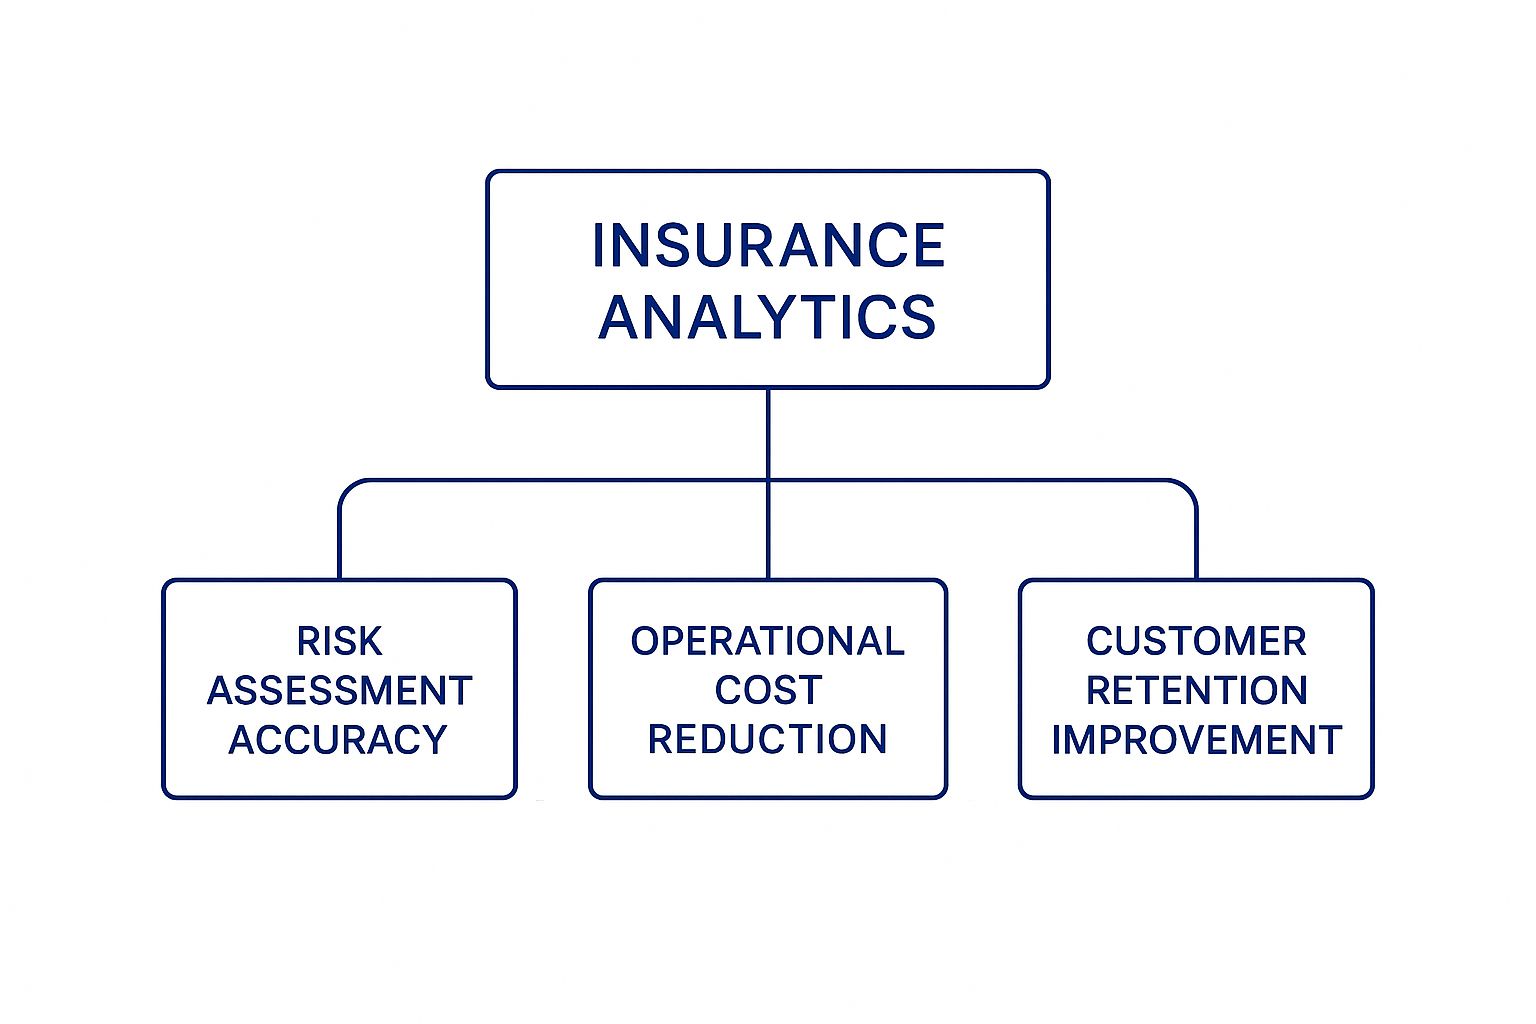
As this breakdown demonstrates, focusing on analytics is not just a technology initiative; it is a direct route to more accurate risk assessment, improved cost efficiency, and enhanced operational resilience.
Let's examine how this framework operates in practice.
Descriptive Analytics: The Foundation
Descriptive analytics is the foundational layer. It answers the fundamental question: “What happened?” This involves summarizing historical data to provide a clear picture of past events.
For an insurer covering Texas industries, this might be a dashboard showing the total value of claims filed by manufacturing facilities in Harris County during the previous hurricane season. Simple, yet essential.
This type of analysis provides the necessary context for operations. It organizes complex data into accessible reports and dashboards, tracking key performance indicators (KPIs) like claim frequency, policy growth, or loss ratios over a specified period. While it doesn't explain why something occurred, it delivers the foundational "what" required for any deeper investigation.
Diagnostic Analytics: Finding the Cause
Once you know what happened, the next logical question is, “Why did it happen?” This is the domain of diagnostic analytics. It involves drilling down into the data to identify root causes and establish relationships between different variables.
For example, consider a severe hailstorm moving through North Texas. A descriptive report might show a 300% spike in commercial auto claims. Diagnostic analysis would take this further, correlating the claims data with meteorological records and geographic information. It might reveal that facilities with unprotected vehicle fleets or older assets were disproportionately affected, providing a critical insight into true risk concentrations.
Predictive Analytics: Forecasting the Future
This is where the focus shifts from hindsight to foresight. Predictive analytics answers the question: “What is likely to happen next?” This pillar utilizes statistical models and machine learning algorithms to forecast future outcomes based on historical patterns and real-time data. It is about calculating the probability of a future event.
A practical example for a construction firm on the Gulf Coast would be using predictive models to forecast the likelihood of project delays due to extreme heat or tropical storms. By analyzing historical weather patterns and project data, an insurer can anticipate potential claim surges and advise clients on proactive mitigation measures.
Executing these forecasts requires robust data and sophisticated analytical tools. You can explore some of the most critical methods in our guide to climate risk assessment tools.
By forecasting potential outcomes, predictive analytics allows businesses to shift from a reactive stance to a proactive one, preparing for disruptions before they occur and minimizing their impact on operations.
Prescriptive Analytics: Recommending Action
This is the final and most advanced pillar. Prescriptive analytics addresses the ultimate question for any decision-maker: “What should we do about it?” It moves beyond predicting an outcome by recommending specific, data-backed actions to achieve a desired goal or mitigate a potential risk.
Returning to the hurricane example, if predictive models forecast a high probability of a Category 4 storm impacting a logistics hub near Corpus Christi, prescriptive analytics could run simulations to recommend the optimal course of action.
It might suggest rerouting 75% of incoming shipments, relocating high-value assets to a secure inland facility, and pre-positioning claims adjusters. It provides a clear, data-driven action plan designed to minimize losses and maintain business continuity.
How Data Transforms Core Insurance Functions

Insurance analytics is a practical tool that fundamentally reshapes core business functions. When applied effectively, data transforms underwriting, claims management, and fraud detection from reactive, manual processes into proactive, intelligent operations. This shift creates tangible value by improving accuracy, speed, and efficiency.
The significant investment in this area confirms its importance. In the U.S. alone, the insurance analytics market was valued at approximately $15.4 billion in 2024. Projections indicate this figure will grow to nearly $60 billion by 2033, expanding at an annual rate of 15.99%. This growth is a direct result of the massive volumes of data now available, which necessitate advanced tools for analysis.
Let's examine the real-world impact on three critical insurance functions.
Revolutionizing Underwriting and Risk Pricing
Historically, underwriting relied on broad demographic data and outdated loss tables, resulting in a one-size-fits-many approach that failed to capture the unique risk profile of a specific asset or business. This often led to inaccurate pricing—either overcharging and losing business or undercharging and assuming excessive risk.
Data analytics fundamentally changes this model.
Instead of categorizing clients into generalized buckets, underwriters can now access a wealth of granular data. For a logistics company operating in Texas, an analytics-driven underwriter could integrate:
- Vehicle Telematics: Real-time data on driver behavior, route efficiency, and vehicle maintenance schedules. Our guide on telematics for insurance explores how this technology is transforming risk assessment.
- Weather Data: Historical and predictive weather information for specific fleet routes, identifying corridors prone to flash floods or hail.
- Cargo Information: Details on the nature of goods being transported to better understand liability exposure.
By weaving these disparate data streams together, an insurer can move beyond simple factors like fleet size and offer truly personalized risk pricing. A company with a strong safety record and well-maintained vehicles is rewarded with more favorable terms, creating a system that is both fairer and more accurate.
Analytics allows underwriters to price risk with surgical precision, moving from broad assumptions to evidence-based assessments that reflect an asset's true exposure.
Accelerating and Automating Claims Processing
The claims process is a critical touchpoint for any policyholder. A slow, cumbersome experience can permanently damage a client relationship, while a fast, transparent one builds loyalty. Traditionally, claims management has been a bottleneck, hampered by manual inspections, extensive paperwork, and lengthy review cycles.
AI-powered analytics eliminates these inefficiencies.
Consider a hailstorm that damages a fleet of commercial vehicles at a manufacturing plant.
- Before Analytics: An adjuster would need to travel to the site, manually inspect each vehicle, take photographs, and compile a detailed report. This process could take days or even weeks, delaying repairs and disrupting the client's operations.
- After Analytics: The plant manager can upload photos of the damage via a mobile application. An AI model instantly analyzes the images, assesses the damage against policy terms, and generates a preliminary settlement estimate, often within minutes.
This automation not only dramatically reduces settlement times but also frees up human adjusters to focus on the most complex and severe claims where their expertise is most valuable. The result is a faster process that helps businesses resume operations quickly and improves customer satisfaction.
The table below outlines how these analytical capabilities create specific advantages across different departments within an insurance company.
Impact of Analytics Across Insurance Departments
| Department | Primary Application of Analytics | Key Business Benefit |
|---|---|---|
| Underwriting | Granular risk modeling using telematics, weather, and property data. | More accurate risk pricing, improved profitability, and competitive advantage. |
| Claims | AI-driven damage assessment and automated workflow management. | Drastically reduced claims cycle times and enhanced customer satisfaction. |
| Marketing & Sales | Customer segmentation and predictive modeling for cross-sell/up-sell. | Higher conversion rates and increased customer lifetime value. |
| Fraud Detection | Real-time pattern recognition and network analysis on claims data. | Significant reduction in fraudulent payouts and lower premium costs for all. |
This summary illustrates that analytics is not a siloed function; its benefits extend across the entire organization, enhancing efficiency and decision-making at every level.
Detecting and Preventing Fraud in Real-Time
Insurance fraud costs billions of dollars annually, ultimately increasing premiums for all policyholders. Traditional fraud detection methods were reactive, relying on random audits or tips to identify fraudulent activity after payments had already been disbursed. This made it nearly impossible to detect sophisticated, organized fraud rings.
Modern analytics provides insurers with a powerful new tool in this ongoing battle.
Machine learning algorithms can analyze millions of claims in real-time, identifying subtle patterns and anomalous connections that are invisible to the human eye. These systems can flag suspicious activity as it occurs—such as multiple claims filed from the same address with different carriers or a provider billing for an unusually high number of procedures. By identifying these red flags instantly, insurers can intervene before fraudulent payments are made, protecting their bottom line and helping to maintain affordable premiums.
Building a Winning Insurance Analytics Strategy
Possessing advanced analytics tools is only part of the equation; a well-defined strategy is what separates a successful investment from a costly failure. For executives in Texas industries like energy and manufacturing, a clear roadmap is essential to transform data into a tangible asset. This requires a thoughtful approach that aligns technology, personnel, and business objectives from the outset.
The process begins by defining clear, achievable goals. An analytics program without a specific business objective is rudderless. Are you aiming to improve underwriting accuracy for construction clients in hail-prone North Texas? Or is the priority to accelerate claims processing for logistics companies following a Gulf Coast hurricane? Identifying a single, high-value problem to solve first is the most critical step.
Starting with a Solid Foundation
Before any analysis can begin, you must have confidence in your data. This is the role of data governance—the framework of rules and processes that ensures data is accurate, consistent, and secure. Without it, your analytics efforts are built on an unstable foundation, guaranteed to produce flawed insights and poor decisions.
Consider it analogous to constructing a new facility: you wouldn't pour the foundation without first ensuring the ground is stable and the blueprints are correct. Strong governance prepares your data for reliable analysis.
Next, it is essential to foster a data-literate culture. This does not mean every employee must become a data scientist. It is about empowering your teams—from underwriters to claims adjusters—to understand how data can enhance their daily work and feel comfortable using analytics tools to make more informed decisions.
A successful analytics strategy is not just a technology project; it's a business transformation. It demands clear goals, strong governance, and a culture that values data-driven decisions at every level.
The Phased Approach to Implementation
A common mistake is attempting a massive, enterprise-wide analytics overhaul from the start. This approach almost invariably leads to budget overruns and stakeholder fatigue. A more effective method is a phased implementation, beginning with a focused pilot project.
A pilot project is a smaller-scale test designed to solve the single, well-defined business problem you have already identified.
- Prove the Value: A successful pilot delivers a clear return on investment (ROI) that can be demonstrated to leadership, making it easier to secure buy-in and funding for subsequent phases.
- Learn and Adapt: It allows your team to learn new tools and processes in a controlled environment, resolving any issues before scaling up.
- Build Momentum: An early success generates enthusiasm and demonstrates the practical benefits of analytics, helping to overcome resistance to change.
This methodical approach is a core principle of effective operational risk management, as it minimizes disruption while maximizing the likelihood of long-term success.
Selecting the Right Technology Stack
Once your strategy is defined and a pilot project is scoped, it is time to select the appropriate tools. The technology stack you choose must align with your specific objectives. A detailed business intelligence software comparison is a crucial step in guiding this decision. The key is to find platforms that are powerful enough to handle your data yet intuitive enough for your team to use effectively.
By starting with clear goals, establishing strong governance, and adopting a practical, phased approach, you can build an analytics capability that delivers real, measurable results. This strategic discipline is what truly transforms data from a byproduct into a core competitive advantage.
Navigating Future Trends and Current Challenges

Transitioning to an analytics-first model provides a significant competitive advantage, but the path is not without obstacles. To maximize the value of their data, carriers must address several practical hurdles, including navigating complex regulations, securing skilled talent, and modernizing legacy IT systems.
Simultaneously, the industry is on the cusp of a technological wave that will redefine how risk is understood and managed. Building a resilient, future-proof insurance operation requires balancing today's challenges with tomorrow's opportunities.
Overcoming Key Implementation Hurdles
For insurance leaders, particularly in Texas, a few core challenges consistently arise when implementing a comprehensive analytics program. Proactively addressing them is critical for long-term success.
- Ensuring Data Privacy and Regulatory Compliance: The vast amount of data being collected places an enormous emphasis on privacy. Insurers must operate within a complex web of regulations designed to protect consumer information, such as those overseen by the Texas Department of Insurance. A single breach can result in substantial fines and irreparable reputational damage.
- Bridging the Data Science Talent Gap: Finding professionals who possess both a deep understanding of the insurance business and expertise in data science is challenging. This talent shortage can slow or even derail critical analytics initiatives. Companies must decide whether to build an in-house team, upskill current staff, or engage external experts.
- Integrating with Legacy IT Systems: Many established insurers still operate on older IT systems that were not designed for big data. These platforms are often inflexible and difficult to integrate with modern analytics tools. Connecting these systems can be a significant technical challenge—it is time-consuming, expensive, and must be planned carefully to avoid disrupting daily operations.
Successfully implementing analytics is about much more than just the technology. It requires a firm commitment to solving foundational challenges in data governance, talent, and modernizing core systems.
Exploring the Future of Insurance Analytics
While addressing today's challenges, it is essential to keep an eye on the horizon. Several game-changing trends are beginning to reshape the insurance landscape, offering new ways to measure risk, engage with customers, and build trust.
- Generative AI for Enhanced Operations: This technology has evolved far beyond chatbots. It is now being used to automatically summarize complex claims files, draft personalized communications to policyholders, and assist underwriters by flagging potential risks in new applications.
- Telematics and the Internet of Things (IoT): Data from connected devices is enabling the creation of innovative insurance products. For instance, a logistics company can use telematics data from its truck fleet to obtain usage-based insurance, where premiums are directly tied to driver safety and miles driven.
- Blockchain for Transparency and Trust: Blockchain functions as a secure, shared digital ledger, making it ideal for complex transactions involving multiple parties, such as reinsurance. It has the potential to enhance transparency, reduce fraud, and expedite settlements by creating a single, immutable record of transactions.
The market's explosive growth underscores these trends. The global insurance analytics market is expected to grow from $13.84 billion in 2024 to a massive $51.45 billion by 2033, expanding at a rate of approximately 14.4% annually. North America continues to lead this growth, driven by its rapid adoption of new technologies.
To understand how data requirements vary in specific market segments, it is beneficial to review focused research, such as this Life Reinsurance Market Research Report.
These emerging tools are providing insurers and their clients with a much clearer understanding of risk. As these technologies become more mainstream, they will be essential for maintaining a competitive edge. Of course, new technologies introduce new risks. We break down how to protect these digital assets in our analysis of cyber insurance trends. For any business leader, understanding what's next is the first step toward building a more intelligent and resilient operation.
Common Questions About Insurance Analytics
Adopting a data-driven model inevitably raises practical questions. For leaders in Texas industries—from manufacturing and energy to agriculture and logistics—it is essential to understand the real-world application of these concepts. Here are clear answers to common inquiries.
What’s the First Step to Get Started?
The first step is strategic, not technological. Before evaluating any software, your leadership team must answer one critical question: What specific business problem are we trying to solve?
Are you experiencing a high volume of fraudulent claims? Struggling with customer retention? Or finding it difficult to accurately price risk for assets along the Gulf Coast?
Select one high-impact area where improved insight would deliver a tangible business benefit. For a logistics company, that might be gaining control over fleet insurance costs. For a construction firm, it could be understanding operational risks from Texas's volatile weather.
Once you have identified a target, assemble a small, cross-functional team to execute a pilot project. This is key. A focused pilot allows you to prove the ROI quickly, gain broader organizational buy-in, and learn what works before attempting a large-scale, enterprise-wide implementation.
Do We Need to Hire a Whole Team of Data Scientists?
No, especially not at the outset. Attempting to build a full data science team from scratch is a slow and expensive process that can stifle momentum. A more intelligent approach is to empower the experts you already have.
Your current analysts and actuaries possess invaluable domain knowledge about your business and its specific risks. The goal is to equip these professionals with modern, user-friendly business intelligence (BI) tools that make deep analysis more accessible. You are not replacing them; you are augmenting their capabilities.
"The most successful analytics programs almost always start by augmenting existing talent, not replacing it. When you combine deep institutional knowledge with modern tools, you create a powerful synergy that delivers early wins and builds a solid foundation for the future."
You can also engage specialized consultants or utilize an 'Analytics-as-a-Service' platform to fill any expertise gaps. These options provide access to top-tier talent without the overhead of full-time hires. The objective is to build momentum and demonstrate value. Once the business case is proven, you can then consider scaling your internal team.
How Does Analytics Handle Data Privacy and Security?
This is non-negotiable. Data privacy and security must be integrated from day one, not treated as an afterthought. Any robust analytics strategy is built on a foundation of strong data governance principles—a clear set of rules governing how data is collected, stored, used, and protected.
Core practices include:
- Data Anonymization and Pseudonymization: These techniques remove or mask personally identifiable information (PII) from your datasets, allowing you to gain analytical insights without compromising sensitive customer details.
- Strict Access Controls: Role-based access ensures that individuals can only view the data they absolutely need to perform their jobs. This is one of the most effective ways to minimize the risk of a breach.
- Compliance-Focused Platforms: Modern analytics platforms are designed with regulatory compliance in mind. They include built-in features that help you adhere to complex rules and maintain a clear audit trail.
The objective is simple: use data ethically and securely. For any Texas business handling sensitive client or operational data, this is not optional. It protects your customers, your reputation, and your bottom line.
How Long Until We See a Return on Investment?
The timeline for realizing a return on investment (ROI) from analytics for insurers is not fixed—it depends entirely on your implementation approach. If you attempt a massive, enterprise-wide overhaul of legacy systems, it could be years before you see a clear return.
This is precisely why the phased, pilot-project approach is so effective. By focusing on a specific, high-value business problem, you can achieve measurable results much more quickly.
For example, an insurer using a new tool to identify fraudulent activity could see a significant reduction in improper payouts in just six to nine months. An initiative to automate a portion of the underwriting process could deliver substantial efficiency gains within a few quarters.
The key is to define success metrics before you begin. By starting small, focusing on a clear objective, and tracking your progress, you can build a powerful business case supported by real numbers. This is how you secure the buy-in needed to expand your analytics capabilities.
At ClimateRiskNow, we understand that navigating Texas's unique operational risks requires precise, location-specific intelligence. Our platform equips decision-makers with the actionable data needed to protect assets and ensure business continuity against extreme weather threats. Discover how our detailed risk assessments can empower your strategic planning by requesting a demo.