
For business decision-makers in Texas—especially in the Energy, Manufacturing, Logistics, Agriculture, and Construction sectors—a hurricane is not a random act of nature. It is a recurring operational threat, one that brings devastating financial and logistical consequences with each landfall. Effective preparation requires moving beyond reactive checklists to make data-driven risk management a core strategic function. It is essential for operational continuity and long-term viability.
Why Hurricane Preparedness Is a Strategic Imperative in Texas
For Texas industries, hurricanes represent a severe and predictable business risk. However, the danger extends far beyond direct physical damage to a facility. The most significant and lasting costs of a storm often arise from the cascade of operational failures that ripple through a business and its supply chain for weeks, and even months, afterward.
A hurricane's true impact is a complex web of disruptions that can paralyze even the most robust operations.
Consider the aftermath of a major storm. The challenge is not merely repairing a damaged roof; it is attempting to function in a landscape where critical infrastructure has failed. Roads are impassable. Ports are closed. The power grid is down for days, sometimes weeks. These are not minor inconveniences; they are events that grind production to a halt, sever supply chains, and leave valuable assets stranded.
Beyond Direct Damage: The True Operational Costs
Often, the most significant financial losses are unrelated to the storm's direct impact. They stem from these secondary effects. A manufacturing plant that survives a hurricane untouched is still crippled if its suppliers are offline or its logistics partners cannot get trucks to the facility. An energy company faces immense pressure when skilled technicians cannot reach critical sites to assess damage and begin repairs because they are contending with personal displacement.
This is where operational vulnerabilities create a costly ripple effect:
- Supply Chain Paralysis: Critical components do not arrive. Finished products cannot reach customers. This leads directly to contractual penalties and lost revenue.
- Infrastructure Failure: The loss of power, water, and communications paralyzes industrial processes and basic administrative functions.
- Workforce Displacement: Employees dealing with personal losses or evacuation orders create critical, unexpected labor shortages at the most crucial time.
- Regulatory Scrutiny: Post-disaster, maintaining environmental and safety compliance becomes a massive challenge, attracting intense oversight from regulators and potentially leading to fines.
Viewing a hurricane solely through the lens of potential property damage is a critical strategic error. The real threat lies in prolonged operational downtime, which can inflict far greater financial harm than the storm itself.
Understanding these interconnected vulnerabilities is the first step toward building genuine resilience. Hurricanes are just one of many potential disruptions; explore a broader range of threats in our guide to common natural risk examples affecting businesses today.
Disclaimer: The information provided in this article is for educational purposes only. ClimateRiskNow does not sell insurance or financial products and this content should not be interpreted as financial advice or an insurance recommendation.
Learning From Past Storms: Case Studies for Texas Industries

To build a robust preparedness plan, Texas business leaders must analyze how past hurricanes have crippled regional operations. History provides a clear, evidence-based blueprint of specific vulnerabilities.
Major storms like Hurricanes Harvey and Ike were not just weather events; they were brutal stress tests that exposed deep-seated weaknesses across the state’s economic infrastructure. Analyzing their impact transforms risk from a theoretical concept into a tangible, dollars-and-cents business reality. These storms left a trail of data on operational failures and supply chain breaks that provide invaluable lessons for today.
Energy and Petrochemical Sector Under Siege
When Hurricane Harvey made landfall in 2017, the impact on the Energy and Petrochemical sector was swift and severe. Widespread flooding and power outages forced the shutdown of nearly a quarter of U.S. refining capacity, much of it concentrated along the Texas Gulf Coast. This was not just a problem for individual facilities; it triggered a cascade of disruptions across the entire national energy supply chain.
The operational consequences included:
- Refinery Shutdowns: Major facilities went offline for extended periods, leading to significant production losses and price volatility.
- Pipeline Disruptions: Critical distribution arteries like the Colonial Pipeline were forced to operate at reduced capacity or shut down completely, choking off fuel supplies.
- Infrastructure Damage: Storm surge and flooding damaged storage tanks, processing units, and electrical systems, requiring lengthy and expensive repairs.
These events proved that even the most hardened facilities are vulnerable to failures in surrounding public infrastructure—a critical lesson for any modern risk assessment.
Manufacturing and Logistics Paralyzed by Gridlock
For the Manufacturing and Logistics sectors, hurricanes expose a critical dependency on a functioning power grid and transportation networks. During Hurricane Ike in 2008, widespread power outages halted production lines for days, and in some cases, weeks. The storm’s impact on key infrastructure, like the Port of Houston, created a logistical nightmare.
Port closures and impassable roads effectively severed the arteries of commerce. This paralysis meant raw materials could not get in and finished goods could not get out. The result was costly delays, contractual penalties, and damaged customer relationships.
The key takeaway from past hurricanes is that operational continuity depends on a complex ecosystem. A business is only as resilient as its most vulnerable supplier, utility provider, or transportation route.
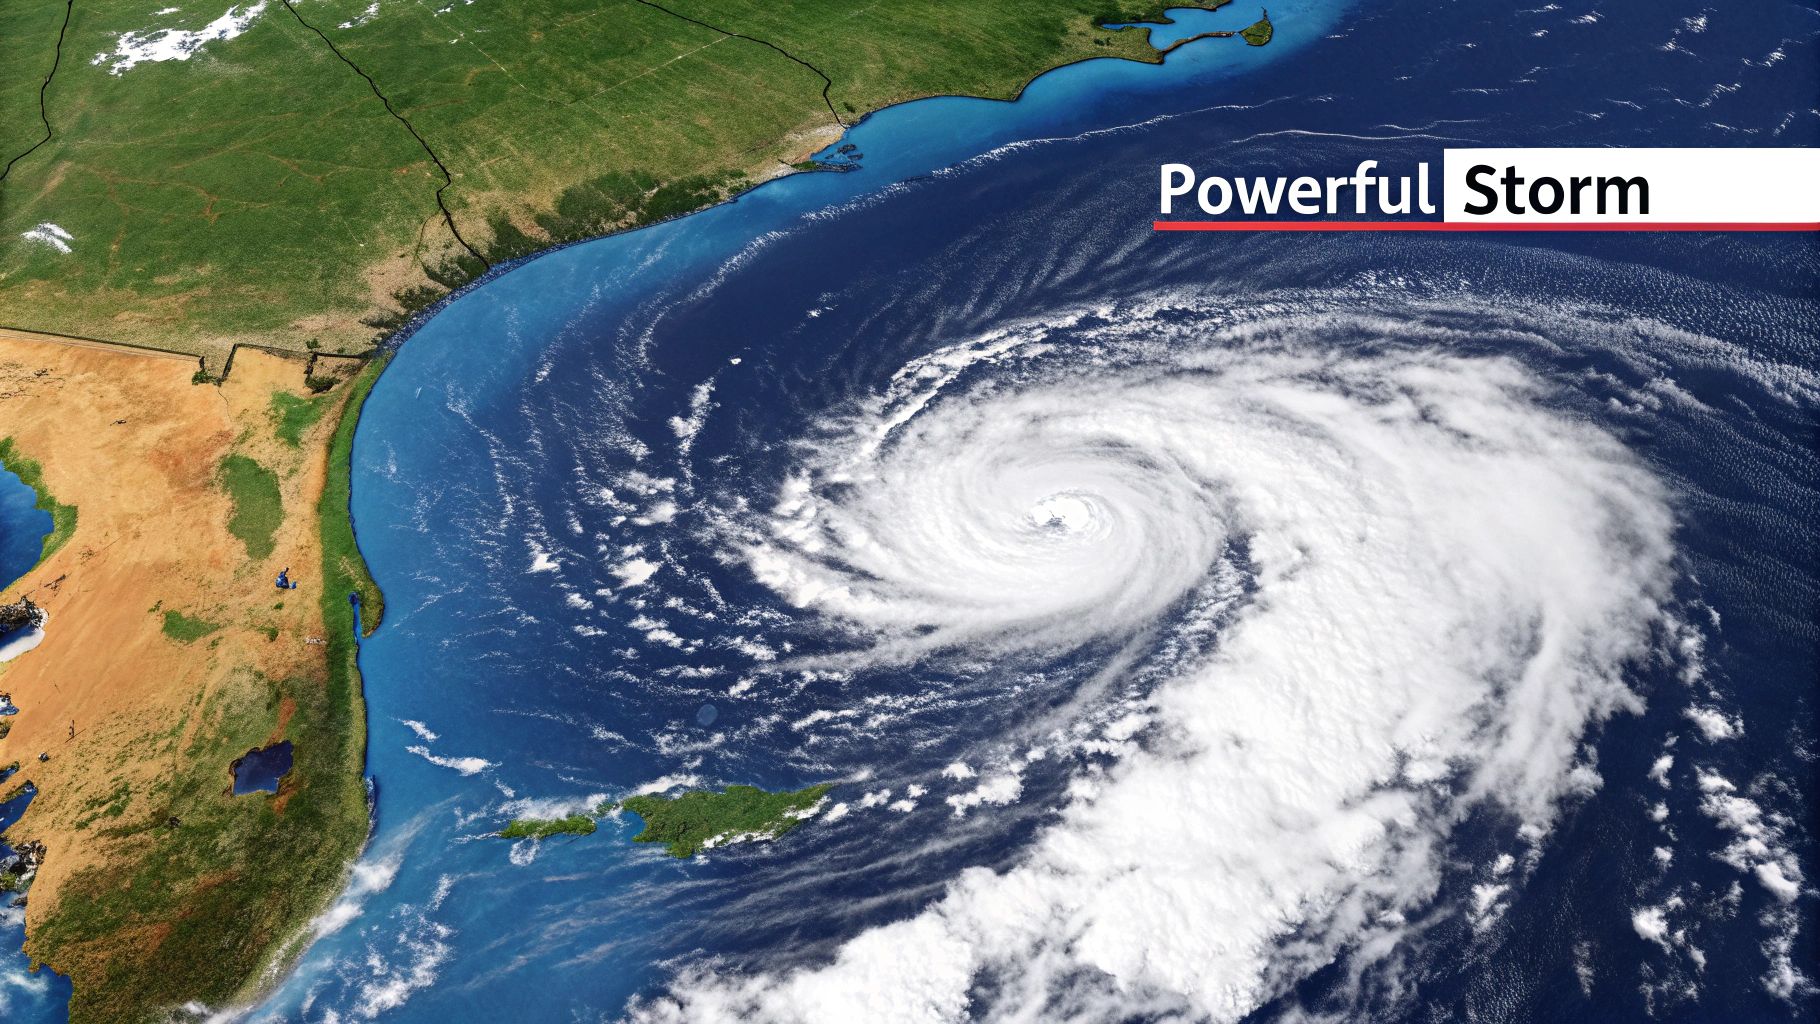
Since record-keeping began in 1851, the Atlantic basin has generated 1,745 tropical cyclones, with 971 reaching hurricane strength. A storm like Harvey, which caused an estimated $125 billion in damages, demonstrates the high financial stakes. You can explore the history of these powerful storms on Wikipedia’s List of Atlantic hurricane records.
Agriculture and Construction: Devastating Physical and Financial Losses
The Agriculture and Construction sectors face direct physical and financial losses from high winds and catastrophic flooding. Hurricane Harvey, for instance, inflicted an estimated $200 million in crop and livestock losses in Texas alone. Fields were submerged and vital farming infrastructure was destroyed just before harvest.
Construction projects were brought to a complete halt:
- Job sites were flooded, ruining materials and damaging expensive equipment.
- Supply chains for essential building materials like lumber and concrete were severed.
- Workers were unavailable as they were forced to deal with personal emergencies and evacuations.
These are not just historical anecdotes; they are critical data points. By studying these events, business leaders can pinpoint specific failure points relevant to their own operations. Understanding these details is crucial, which is why we have analyzed the specific vulnerabilities revealed by Hurricane Harvey lessons learned in a separate guide.
Disclaimer: The information provided in this article is for educational purposes only. ClimateRiskNow does not sell insurance or financial products and this content should not be interpreted as financial advice or an insurance recommendation.
Mapping Your Company's Hurricane Vulnerabilities
Historical context is important, but true preparedness requires shifting from general awareness to a focused analysis of your own company's operational weak points. The most effective risk management strategies are built on a detailed vulnerability map that identifies precisely where a storm will cause the most disruption. This process turns an abstract threat into a concrete, actionable plan.
The methodology is straightforward: overlay your critical business assets onto reliable hazard data. By visualizing where your operations intersect with known hurricane risks, you can identify your greatest vulnerabilities and begin reinforcing them long before a storm watch is issued. This is the foundational step toward building genuine operational resilience.
Leveraging Public Data for Pinpoint Analysis
A vast amount of high-quality data is publicly available to help Texas business leaders perform this analysis. Federal agencies provide powerful tools that serve as the building blocks for a comprehensive vulnerability assessment. The key is knowing which sources to use and how to apply them to your specific business context.
Three primary data sources are essential for this assessment:
- NOAA Historical Data: The National Oceanic and Atmospheric Administration maintains an extensive database of past storm tracks, intensities, and impacts. This data is invaluable for identifying regional threat patterns and understanding the frequency of hurricane landfalls near your facilities or critical supply routes.
- FEMA Flood Maps: The Federal Emergency Management Agency provides detailed flood maps that delineate areas most at risk. For any facility in a low-lying or coastal region, these are non-negotiable for assessing the specific risk of flooding from storm surge and heavy rainfall.
- NHC Forecasts: During hurricane season, the National Hurricane Center provides real-time forecasts, including the "cone of uncertainty" and storm surge projections. Integrating these live updates into your operational plan is crucial for making timely, informed decisions as a storm approaches.
This detailed analysis relies on several key public data sets.
Key Data Sources for Hurricane Risk Assessment
| Data Source | Information Provided | Business Application |
|---|---|---|
| NOAA Historical Hurricane Tracks | Tracks, intensity, and landfall data for past storms | Identify long-term storm frequency and common paths near business assets. |
| FEMA Flood Insurance Rate Maps (FIRMs) | Delineates specific flood zones and base flood elevations | Determine if facilities are located in 100-year or 500-year floodplains. |
| NHC Storm Surge Hazard Maps | "Worst-case" storm surge scenarios for different hurricane categories | Assess the potential for catastrophic coastal flooding at specific locations. |
| U.S. Geological Survey (USGS) Elevation Data | Detailed topographic and elevation information | Understand ground elevation to evaluate localized flooding and drainage issues. |
These sources provide the raw data needed to build a clear picture of the external threats facing your Texas operations.
The infographic below illustrates the basic atmospheric conditions required for these powerful storms to develop.
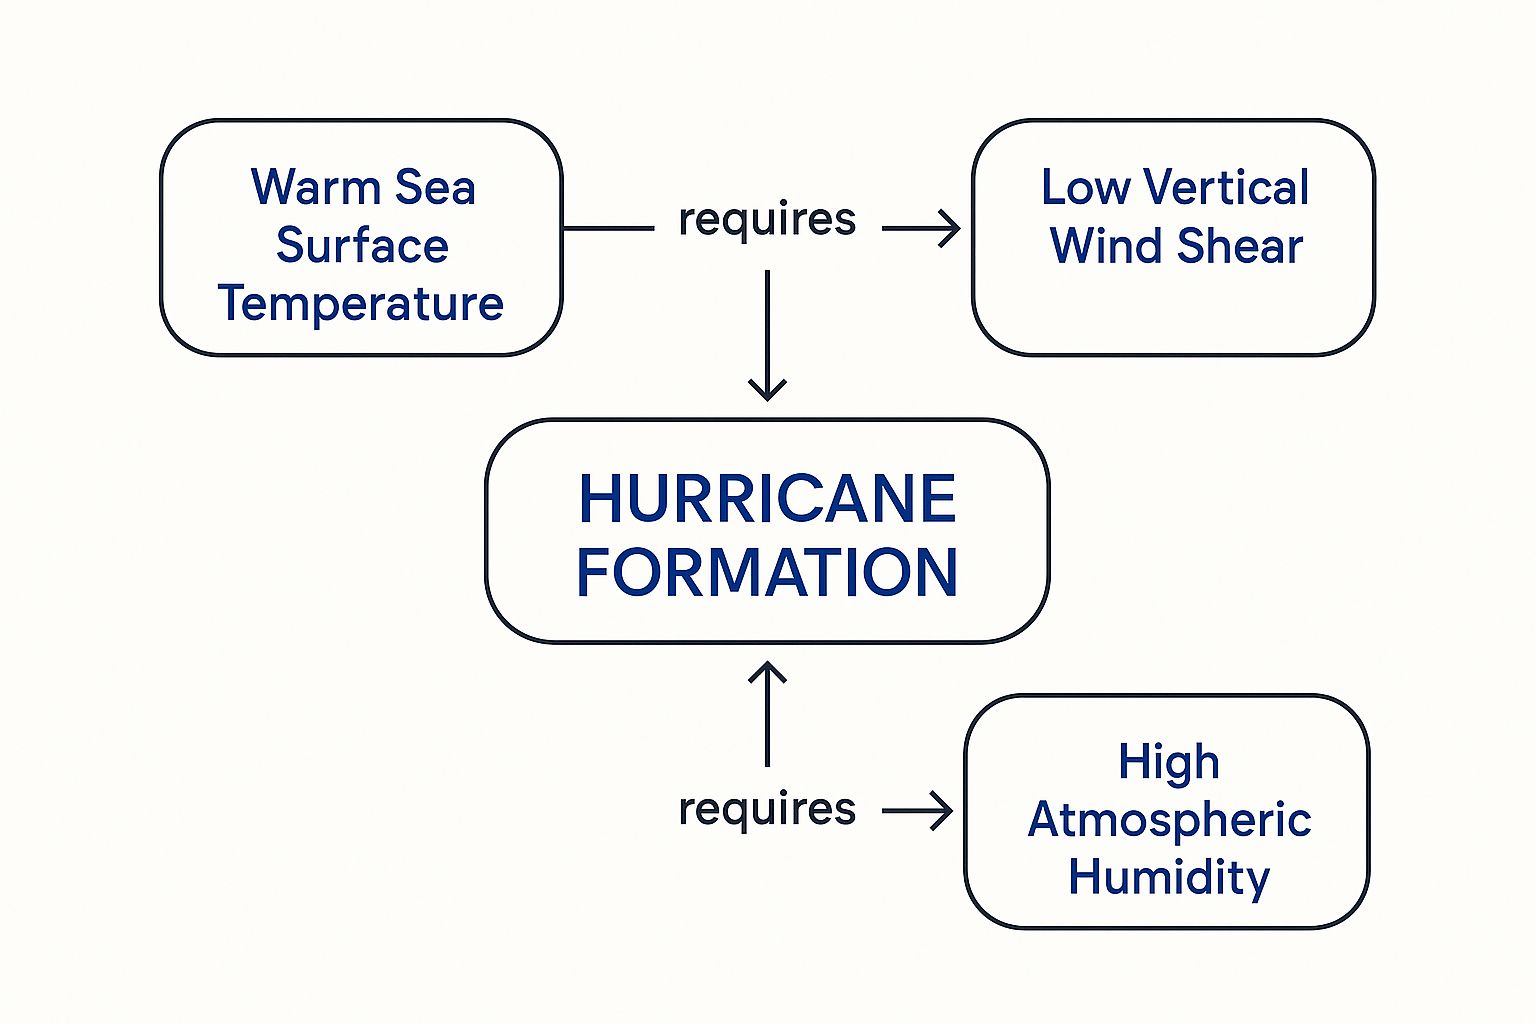
A combination of warm ocean water, moist air, and consistent wind patterns creates the engine that allows a hurricane to form and intensify.
Building Your Operational Risk Map
The real strategic work begins when you merge this hazard data with your company’s own operational footprint. The goal is to create a multi-layered map that clearly highlights points of failure. This involves more than just plotting your headquarters; it requires charting the entire ecosystem your business depends on for survival.
Your operational risk map must include:
- Physical Facilities: Pinpoint every factory, warehouse, refinery, and office. Overlay these locations onto FEMA flood maps and historical storm tracks to assess direct physical risk. Our guide on flood zone mapping for Texas facilities offers a deeper dive into this critical first step.
- Key Suppliers: Identify the locations of your Tier 1 suppliers. A storm impacting a supplier 500 miles away can shut down your production as completely as a direct hit.
- Logistics Routes: Map the highways, rail lines, and ports you rely on for both raw materials and finished products. Analyze how historical storm surge and flooding have disrupted these critical arteries in the past.
- Employee Concentrations: Determine the residential areas of your skilled workforce. Widespread residential flooding or mandatory evacuations can cause crippling labor shortages, even if your facilities remain dry and fully operational.
By methodically layering your asset locations over established hazard zones, you move from a reactive posture to a proactive one. This data-driven approach allows you to prioritize mitigation efforts on the assets and relationships that matter most to your operational continuity.
This is not an academic exercise. The result is a critical strategic document that becomes the foundation for all subsequent actions, from hardening infrastructure to diversifying your supply chain. It provides the hard data needed to justify investments in resilience before the next major storm makes landfall.
Disclaimer: The information provided in this article is for educational purposes only. ClimateRiskNow does not sell insurance or financial products and this content should not be interpreted as financial advice or an insurance recommendation.
Building a Resilient Operational Strategy
A detailed vulnerability map transforms the abstract threat of a hurricane into a concrete, solvable business problem. This clarity allows you to move beyond simple awareness and build a robust operational strategy—one designed to withstand the immense forces of a natural disaster. The goal is to integrate resilience into your company’s core operations, implementing practical measures long before a storm appears on the horizon.
This is not about checking boxes on a generic list. It is a systematic effort to reinforce your operations against predictable points of failure. True resilience comes from a strategy that hardens physical assets, diversifies critical dependencies, and provides your team with clear, actionable protocols to follow when it matters most.
Fortifying Physical Infrastructure
The most immediate threats from a hurricane are physical: high-velocity winds and catastrophic flooding. Hardening your core infrastructure is the foundation of any credible mitigation plan. For businesses in high-risk zones like the Texas coast, this means assessing facilities and implementing upgrades to withstand a major storm.
Begin by evaluating your most vulnerable structures and equipment, using your risk map as a guide. For businesses in coastal or low-lying areas, the first priority is often flood prevention.
- Elevate Critical Equipment: Relocate essential machinery, servers, and electrical panels to higher ground or upper floors. A few feet of elevation can mean the difference between a quick restart and a multi-million-dollar loss.
- Reinforce Structures: Invest in high-impact windows, reinforced roofing, and secure anchoring for large equipment like storage tanks. These upgrades are designed to resist the forces of hurricane-force winds.
- Improve Site Drainage: Ensure your facility's drainage systems are clear and capable of handling extreme rainfall. This simple maintenance task can prevent localized flooding from disrupting your operations.
De-Risking Your Supply Chain
As countless storms have proven, your own facility’s resilience is insufficient if your supply chain crumbles. A hurricane impacting a region hundreds of miles away can halt your production just as effectively as a direct hit. Eliminating single points of failure in your supply network is essential for ensuring operational continuity.
The key is to build redundancy and flexibility into how you source materials and distribute products. Do not wait for a disaster to discover your critical dependencies.
A resilient supply chain is not about finding the cheapest supplier. It is about building a network of partners who can adapt and continue delivering even when a primary route or facility is knocked offline by a storm.
By proactively mapping your suppliers and logistics routes against historical storm tracks, you can quickly identify high-risk partners. From there, you can diversify by qualifying secondary suppliers in different geographic regions. This strategy ensures that if one part of your network goes down, you have pre-vetted alternatives ready, minimizing costly production delays.
Developing a Comprehensive Emergency Response Plan
A solid emergency response plan is the playbook that guides your team through the chaos of a storm. This cannot be a static document; it must be a living guide covering every phase of the disaster, from pre-storm shutdown to post-storm recovery.
The plan must be detailed, clear, and tested regularly. It should provide specific instructions for critical procedures, ensuring an orderly response that protects both personnel and assets.
Key Components of an Effective Response Plan:
- Data Backup and Protection: Implement automated, off-site, and cloud-based backups for all critical business data. Test these systems regularly to guarantee a swift and complete recovery.
- Employee Communication Protocols: Establish a clear, multi-channel communication system (e.g., text alerts, a dedicated phone line, or a company portal) to keep employees updated on facility status, safety instructions, and return-to-work timelines.
- Orderly Shutdown Procedures: Document step-by-step procedures for safely powering down equipment and securing facilities. This minimizes damage and facilitates a faster restart.
- Rapid Restart Sequence: Define the precise order of operations needed to bring your facility back online. This should include pre-arranged agreements with contractors for damage assessment and repairs, placing you at the front of the line for their services.
Creating this structured approach is fundamental to navigating uncertainty. To explore this topic further, you can learn more about developing a comprehensive business resilience framework in our detailed guide.
Understanding the Future of Hurricane Threats
Analyzing past storms provides a critical risk baseline, but a forward-looking strategy requires acknowledging that the nature of hurricanes is changing. For business leaders in Texas, this means looking beyond historical data to prepare for a future where storms exhibit new and more dangerous characteristics. The scientific consensus indicates that storm dynamics are evolving, and the driving factors can amplify their destructive power.
Relying solely on yesterday's storm patterns for tomorrow's capital planning is an inadequate approach to risk management. The operational risks from a natural disaster like a hurricane are not static. They are intensifying in ways that directly threaten infrastructure, supply chains, and business continuity.
The Science of Stronger Storms
One of the primary drivers of this change is rising sea surface temperatures. Warm ocean water acts as fuel for hurricanes. As more heat energy accumulates in the ocean and atmosphere, storms have the potential to intensify more rapidly and reach higher peak intensities.
This contributes to the dangerous phenomenon of rapid intensification, where a hurricane’s maximum sustained winds increase significantly in less than 24 hours. A storm that appears manageable one day can become a catastrophic threat the next, drastically reducing the time available to execute shutdown procedures, secure facilities, and ensure employee safety.
The increasing probability of rapid intensification means that preparedness timelines are shrinking. A reactive, "wait-and-see" approach is no longer a viable risk management strategy for any Texas operation.
This shift demands a much more proactive and continuously updated approach to threat monitoring and response planning.
Measuring the Increasing Power of Hurricanes
Risk analysts use specific metrics to calculate the total energy of an entire hurricane season. Two of the most important are the Accumulated Cyclone Energy (ACE) and the Power Dissipation Index (PDI). These are not abstract scientific terms; they are direct indicators of the destructive potential that businesses must prepare for.
- Accumulated Cyclone Energy (ACE): This index combines the intensity and duration of all tropical storms and hurricanes over a season, providing a comprehensive measure of a season's total activity.
- Power Dissipation Index (PDI): This is closely related to ACE but specifically measures the total power a hurricane releases over its lifetime. It is a metric that correlates directly with the potential for damage.
Data shows a clear upward trend in these metrics. For instance, the ACE index reveals that 8 of the 10 most active years since 1950 have occurred since the mid-1990s. The PDI has also shown a sharp increase that tracks closely with rising sea surface temperatures. You can explore these trends and discover additional insights on the EPA's climate indicators page.
This data confirms that we are not just seeing more storms, but storms that are, on average, more powerful and longer-lasting. This forward-looking view is vital for long-term capital planning, site selection for new facilities, and updating corporate risk models. Integrating these evolving threats into your planning is a core component of effective climate change adaptation strategies that protect your business for the long term.
Disclaimer: The information provided in this article is for educational purposes only. ClimateRiskNow does not sell insurance or financial products and this content should not be interpreted as financial advice or an insurance recommendation.
Your Hurricane Preparedness Questions, Answered
Even with a robust plan, practical questions arise when preparing for a storm. This section addresses some of the most common inquiries from business leaders across Texas with direct, actionable answers to aid your operational planning.
Disclaimer: This information is for educational purposes only. ClimateRiskNow does not sell insurance or financial products. This content should not be taken as financial advice or an insurance recommendation.
When Should We Actually Start Preparing for Hurricane Season?
Effective preparation is a year-round discipline, not a last-minute scramble. While the Atlantic hurricane season officially runs from June 1 to November 30, waiting until a storm is forecast is a recipe for failure.
Use the off-season for strategic initiatives. This is the time to conduct detailed risk assessments, inspect and reinforce infrastructure, review and update continuity plans, and train personnel. Once a storm is imminent, it is too late for proactive measures; you are simply reacting.
A year-round approach integrates preparedness into your standard operations, turning it from a frantic, high-stress event into the execution of a well-rehearsed plan.
During the off-season, focus on these critical tasks:
- Supply Chain Analysis: Map every link in your supply chain to identify geographic vulnerabilities. Begin qualifying alternate suppliers in less storm-prone regions now.
- Update Emergency Contacts: Verify all contact information for employees, key vendors, and emergency response contractors. Outdated information is a critical failure point in a crisis.
- Conduct Tabletop Exercises: Simulate a disaster scenario with your leadership team. These low-stakes exercises are the single best way to identify gaps in your plan before a real storm does.
What Are the Biggest "Hidden" Risks in a Hurricane?
The most costly damage from a hurricane often stems from indirect, delayed impacts that can cripple a business long after the storm passes—even if its own facilities are untouched. A truly resilient plan anticipates these operational aftershocks.
The biggest hidden threats are those that disable the ecosystem your business depends on. These disruptions can inflict far more financial damage than the initial physical impact.
Four major hidden risks demand your attention:
- Supply Chain Paralysis: A storm impacting the coast hundreds of miles away can shut down a critical supplier or block your main shipping routes, leading to production halts and contractual failures.
- Workforce Disruption: Your employees are your most critical asset. If they cannot get to work due to evacuations, flooded roads, or damage to their homes, you will face a major labor shortage when you need it most.
- Extended Utility Outages: The loss of power, water, or communications for days—or even weeks—can render a physically sound facility completely inoperable.
- Reputational Damage: How a company handles a crisis defines its brand. A disorganized or failed response can erode the trust built with customers, investors, and the community.
What's the First Step for a Data-Driven Preparedness Plan?
Start with a comprehensive asset and vulnerability mapping exercise. This foundational step moves your planning from a general sense of risk to a specific, quantified understanding of your real-world exposure. All other mitigation strategies are built upon this analysis.
The process involves two key steps. First, identify every asset critical to your business operations. This includes not just your physical plants and equipment, but also your key transportation routes, essential suppliers, and even the residential areas of your core workforce.
Next, overlay that asset map with reliable hazard data. By layering your operational footprint on top of information from sources like FEMA flood zones, coastal storm surge models, and historical NOAA storm tracks, you gain a clear, data-driven picture of your risk. This analysis pinpoints exactly which assets are most exposed, allowing you to focus resources where they will have the greatest impact.
At ClimateRiskNow, we deliver the data-driven intelligence Texas businesses need to turn complex climate data into clear risk management decisions. Our Sentinel Shield assessments provide the location-specific analysis required to protect your assets and ensure operational continuity.